

Overview
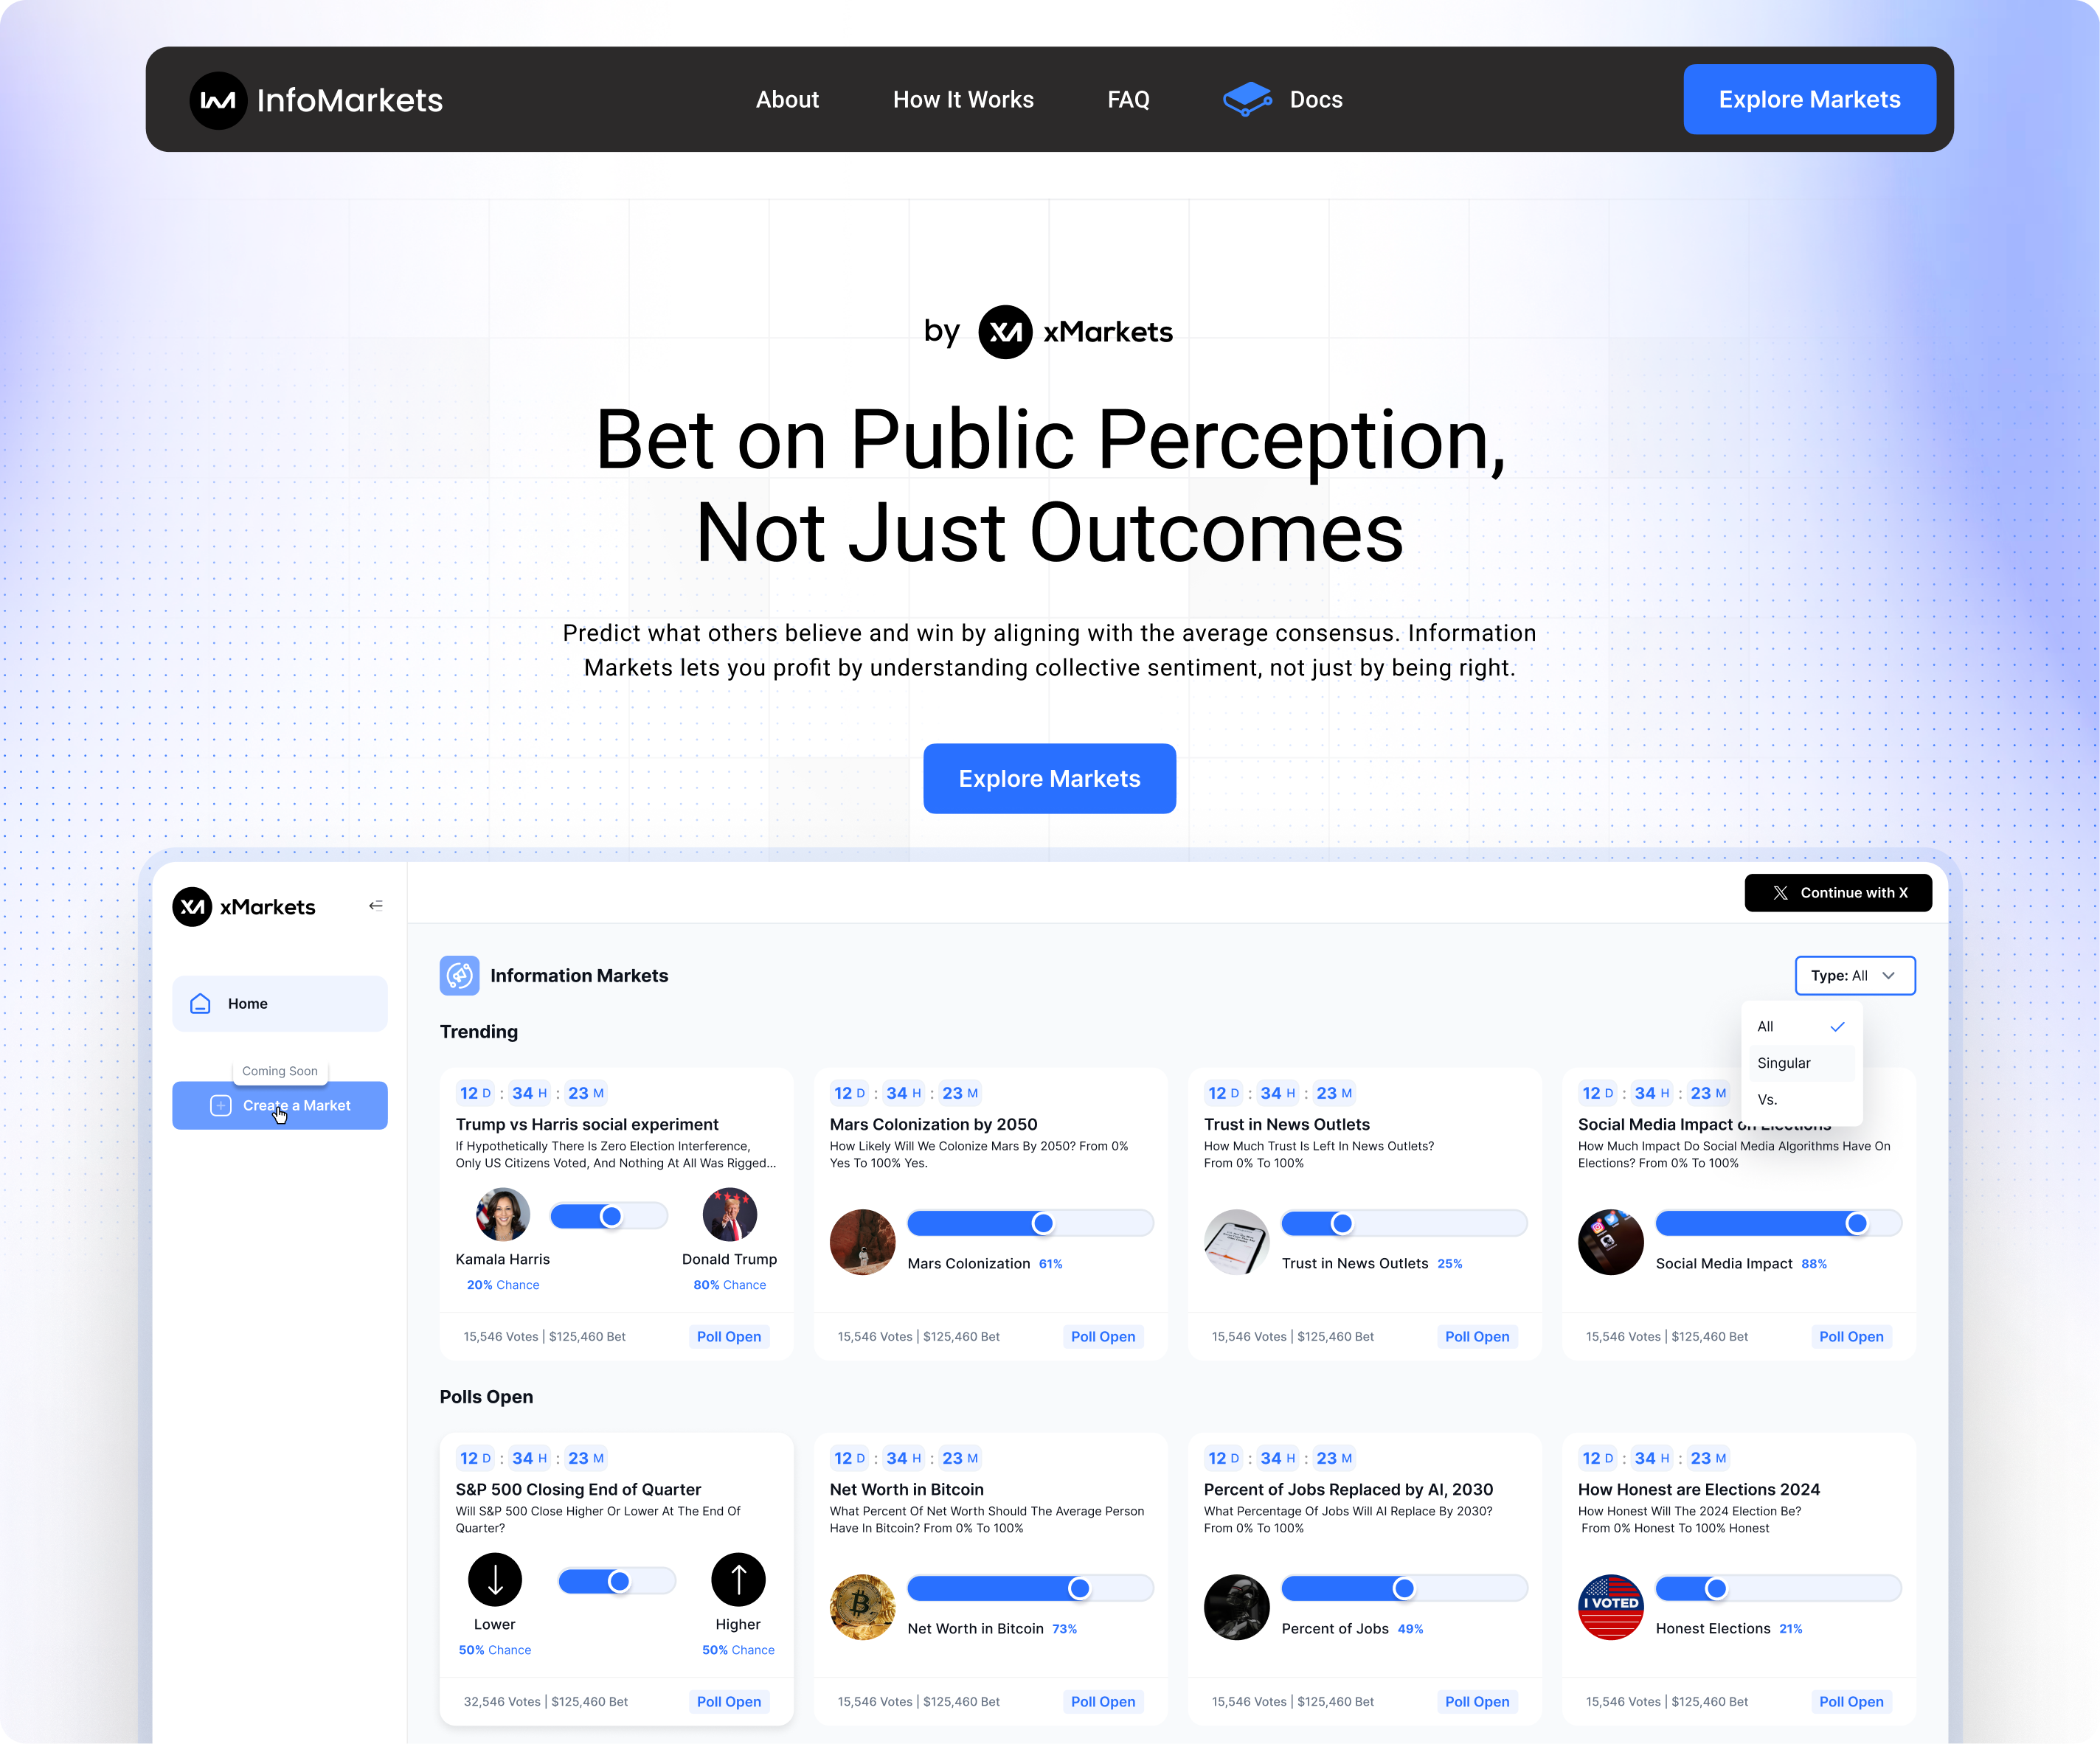
InfoMarkets is a web platform that lets users bet on public perception, not just outcomes. Instead of asking users to predict what will happen, InfoMarkets challenges them to estimate what others believe will happen. It’s a subtle but powerful shift from first-order thinking to second-order consensus prediction.
The result? A gamified, data-rich marketplace that captures real-time public sentiment on everything from politics to tech, and rewards users for social intuition.
Scope
- Product strategy and feature definition
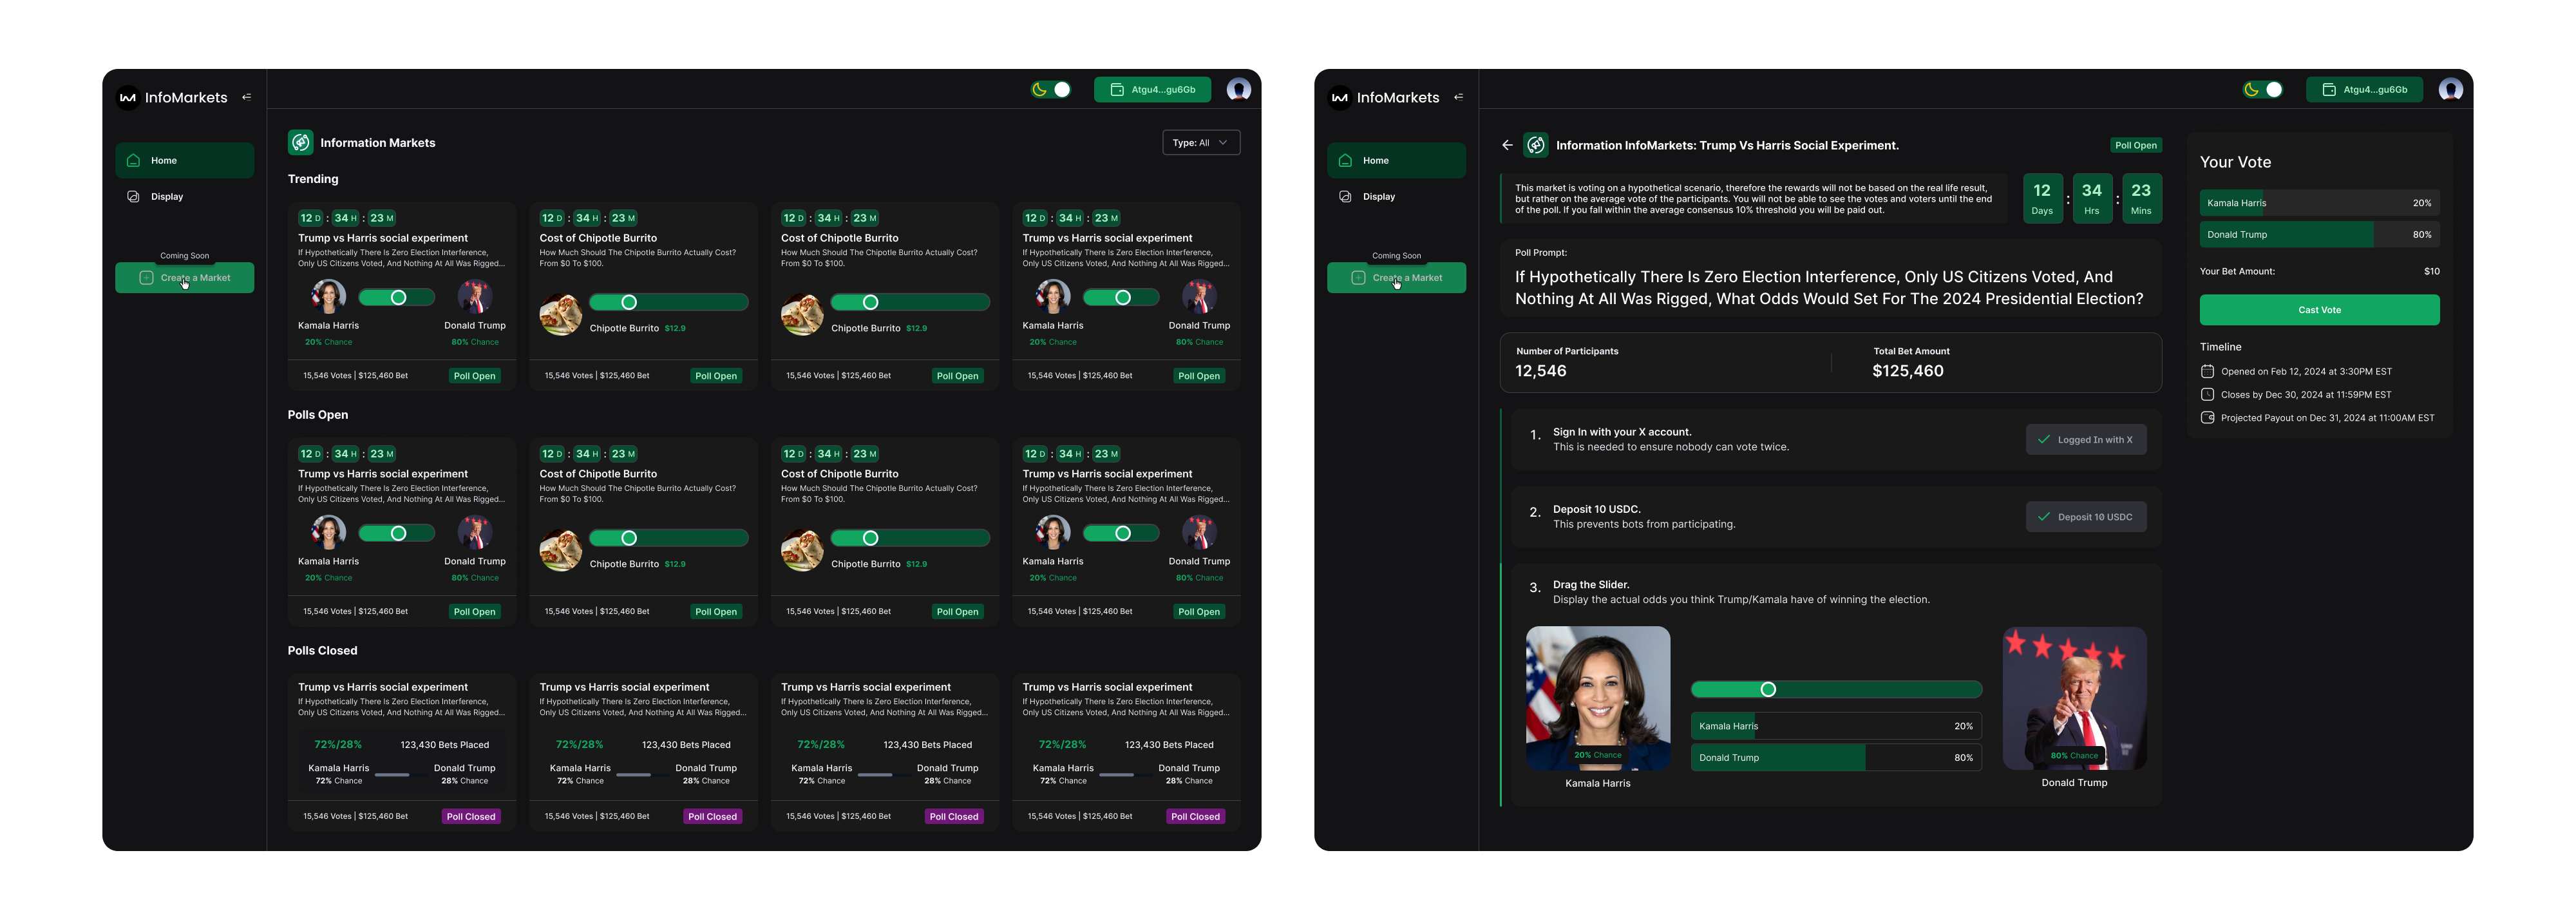
- End-to-end product design (light + dark modes)
- Admin interface design
- Figma design system creation
- Developer handoff & interaction specs
- Brand design, pitch deck, and marketing assets
Problem
Prediction markets are often framed around binary outcomes — right vs. wrong. But public narratives, influence, and decision-making are often shaped by perception, not facts.
Opportunity: Create a new category: Information Markets — where users are rewarded for correctly predicting what the average person believes, rather than what will ultimately occur.
Product Pillars (With UI Callouts)
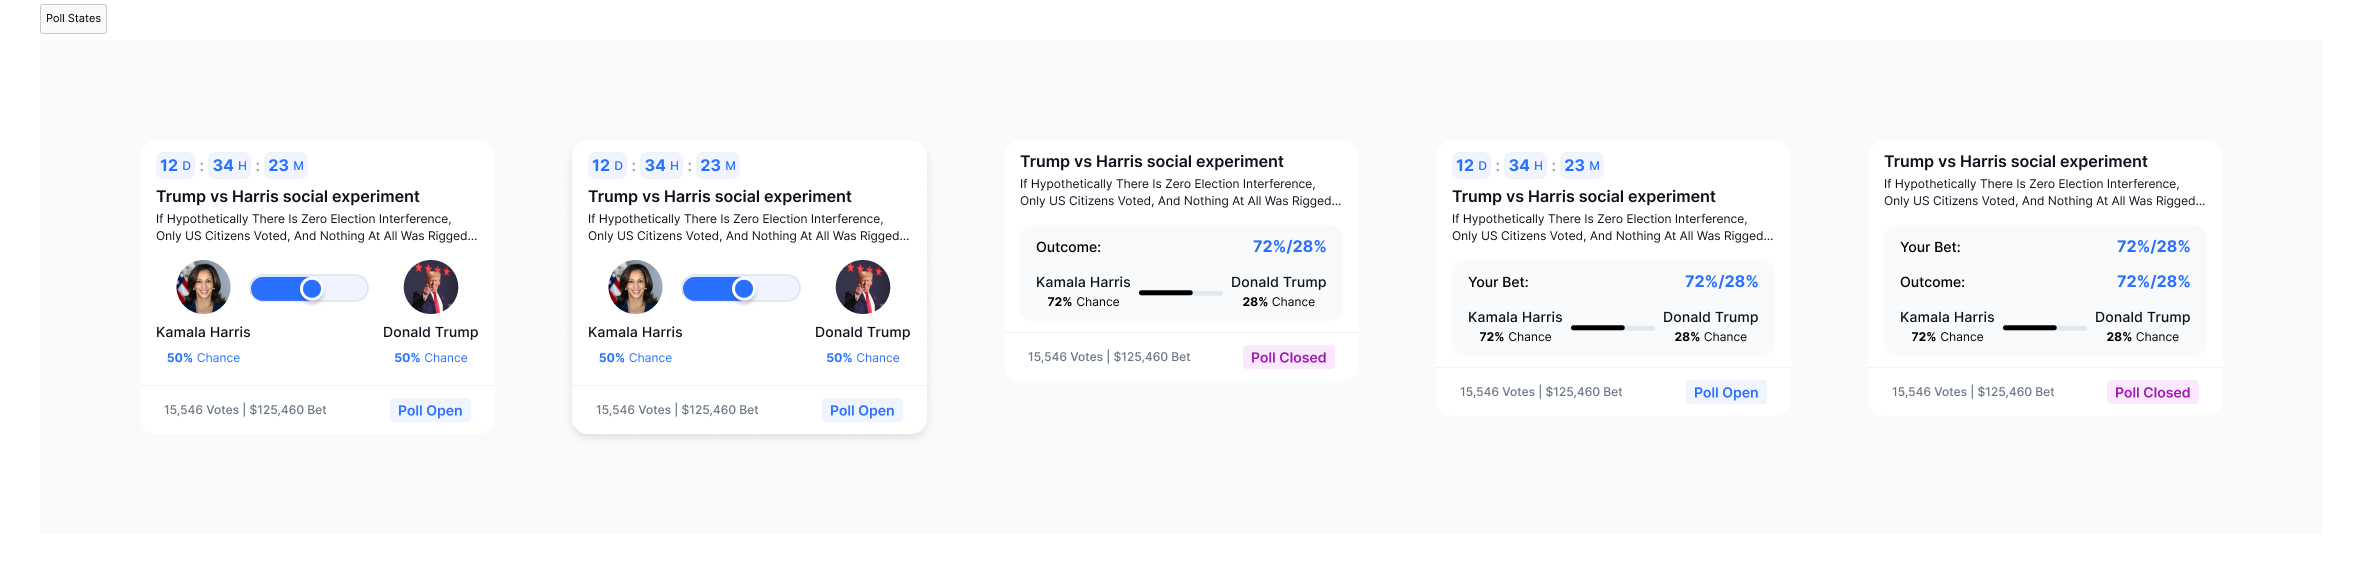
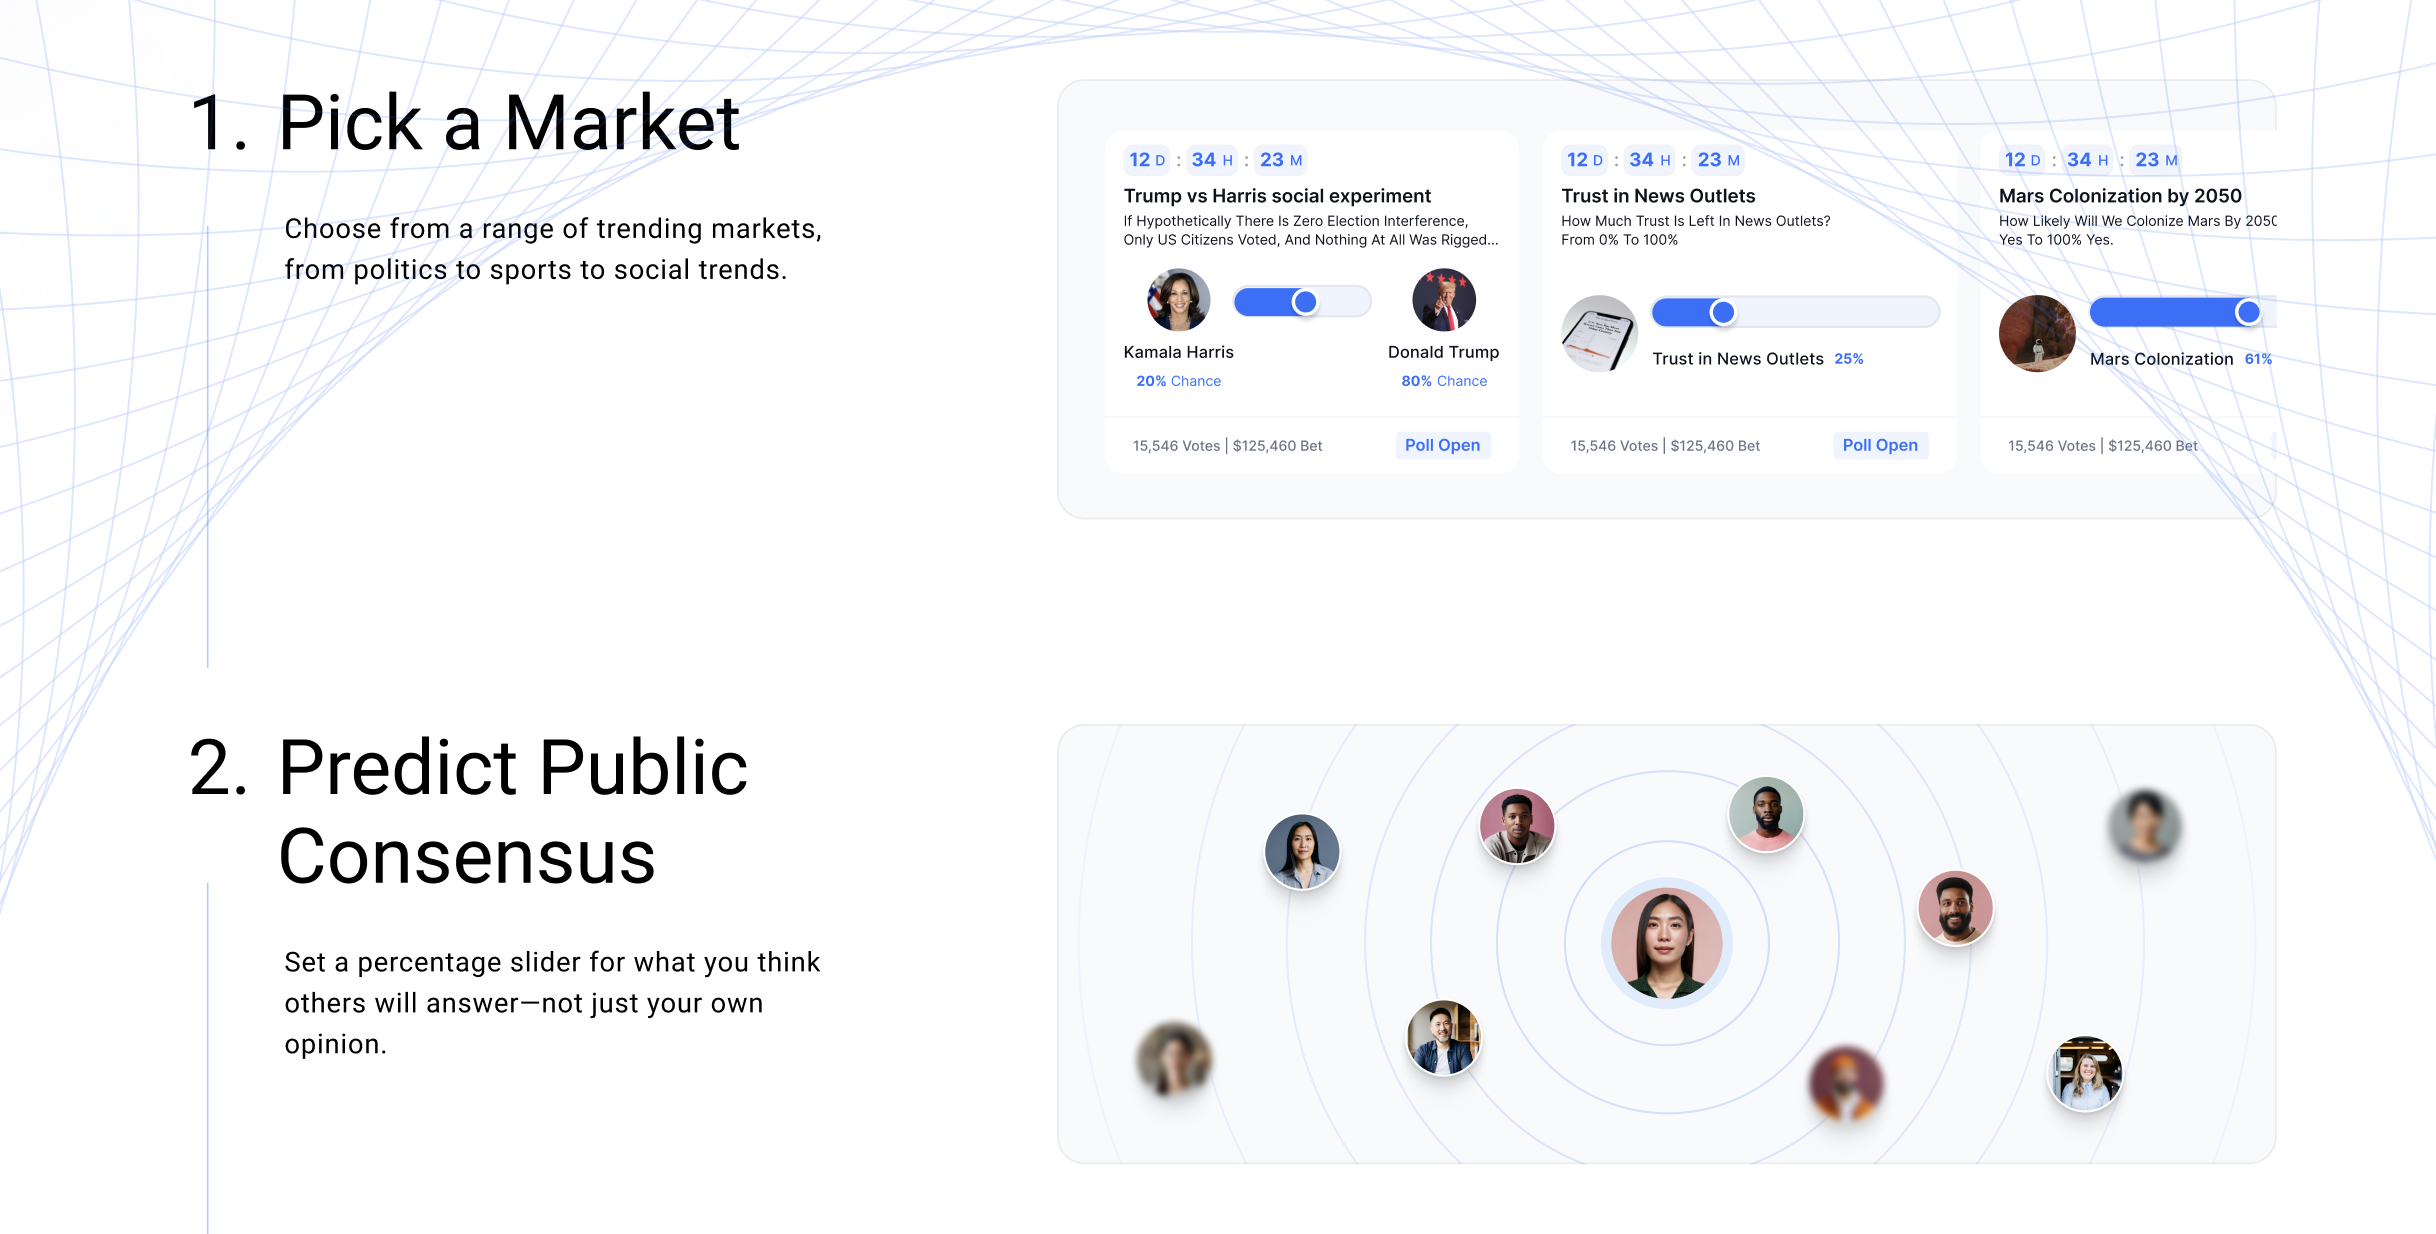
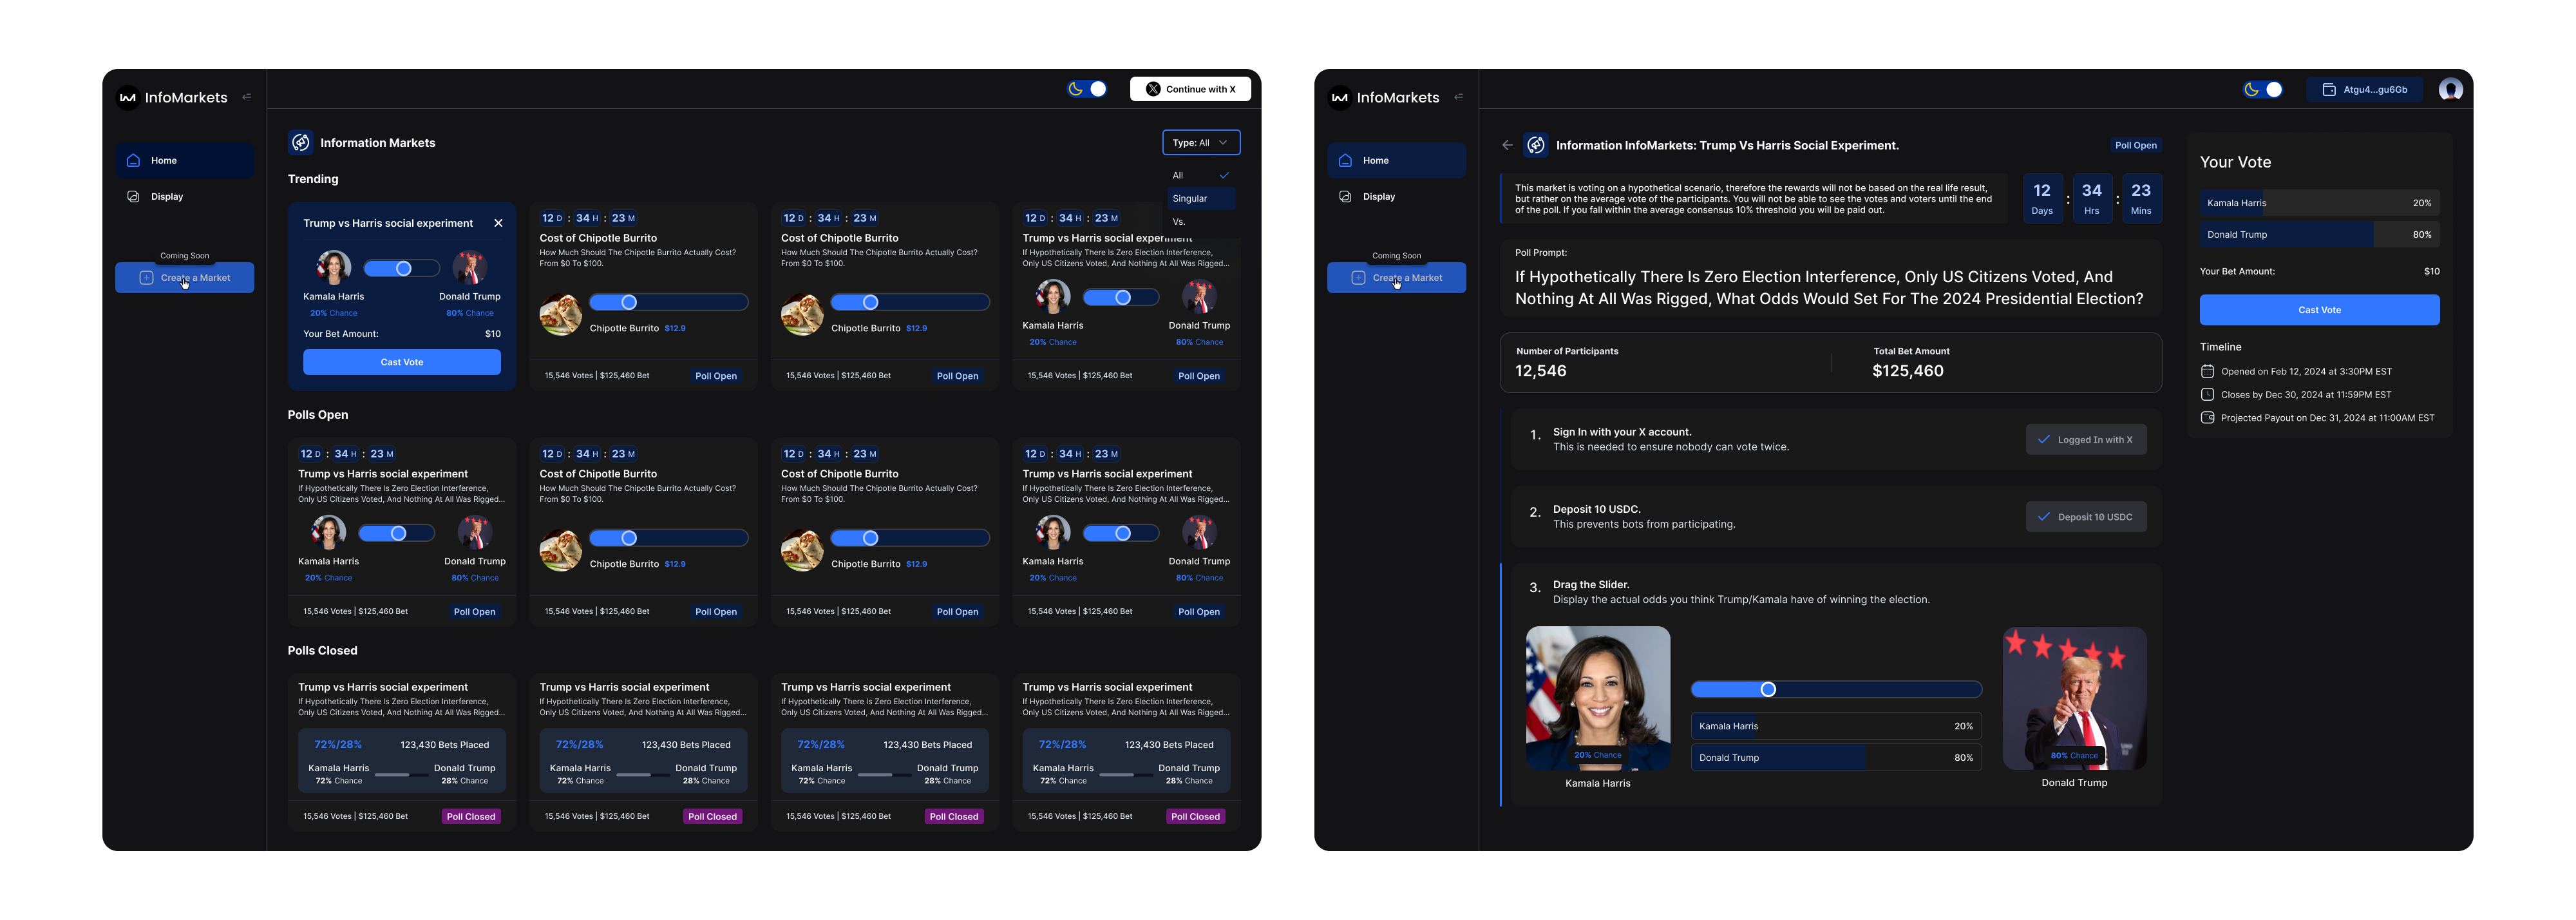
1. Pick a Market
Users browse from a curated set of markets — ranging from political trust levels to sci-fi questions like Mars colonization.
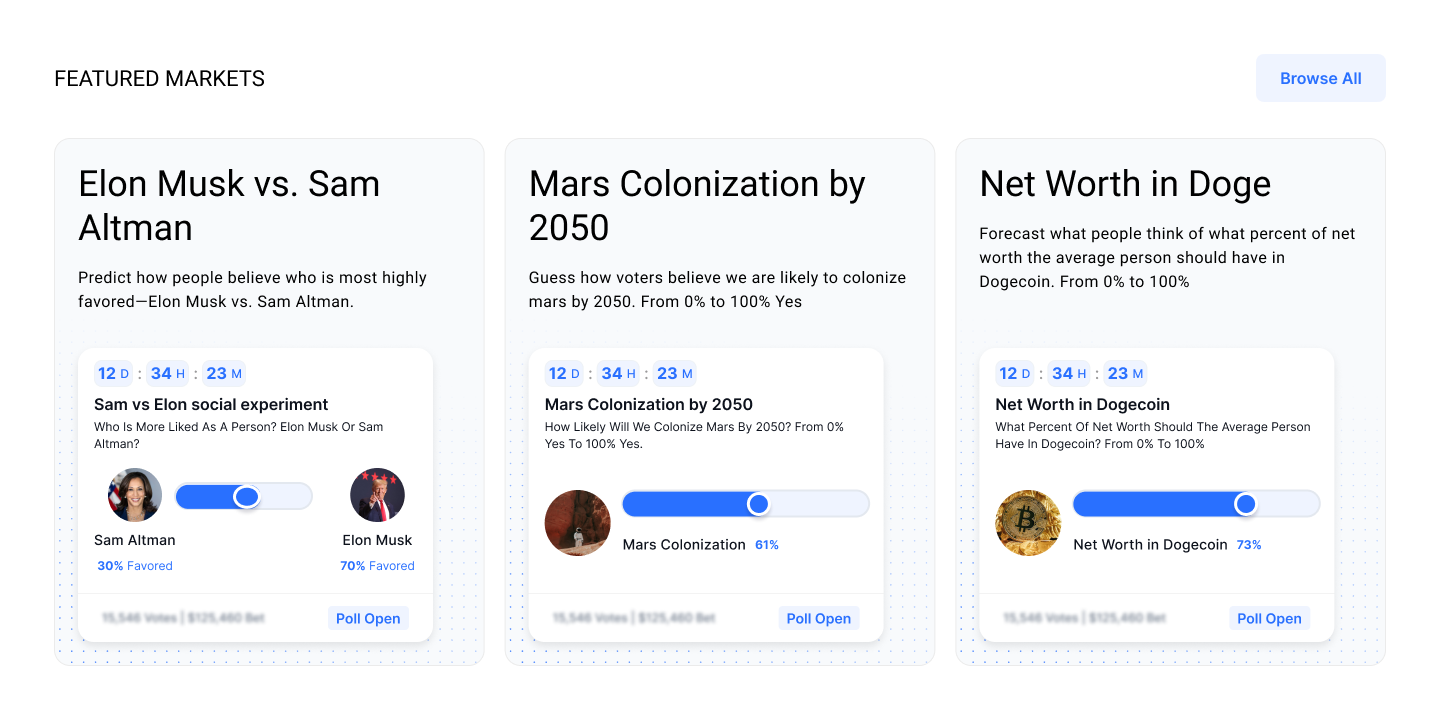
UX Goals:
- Make complex, abstract questions feel visual and engaging
- Let users quickly scan topic, voting options, deadline, and prize pool
Design Highlights:
- Countdown clocks for urgency
- Topic chips (e.g. Politics, Tech, Culture)
- Live voting stats and avatars
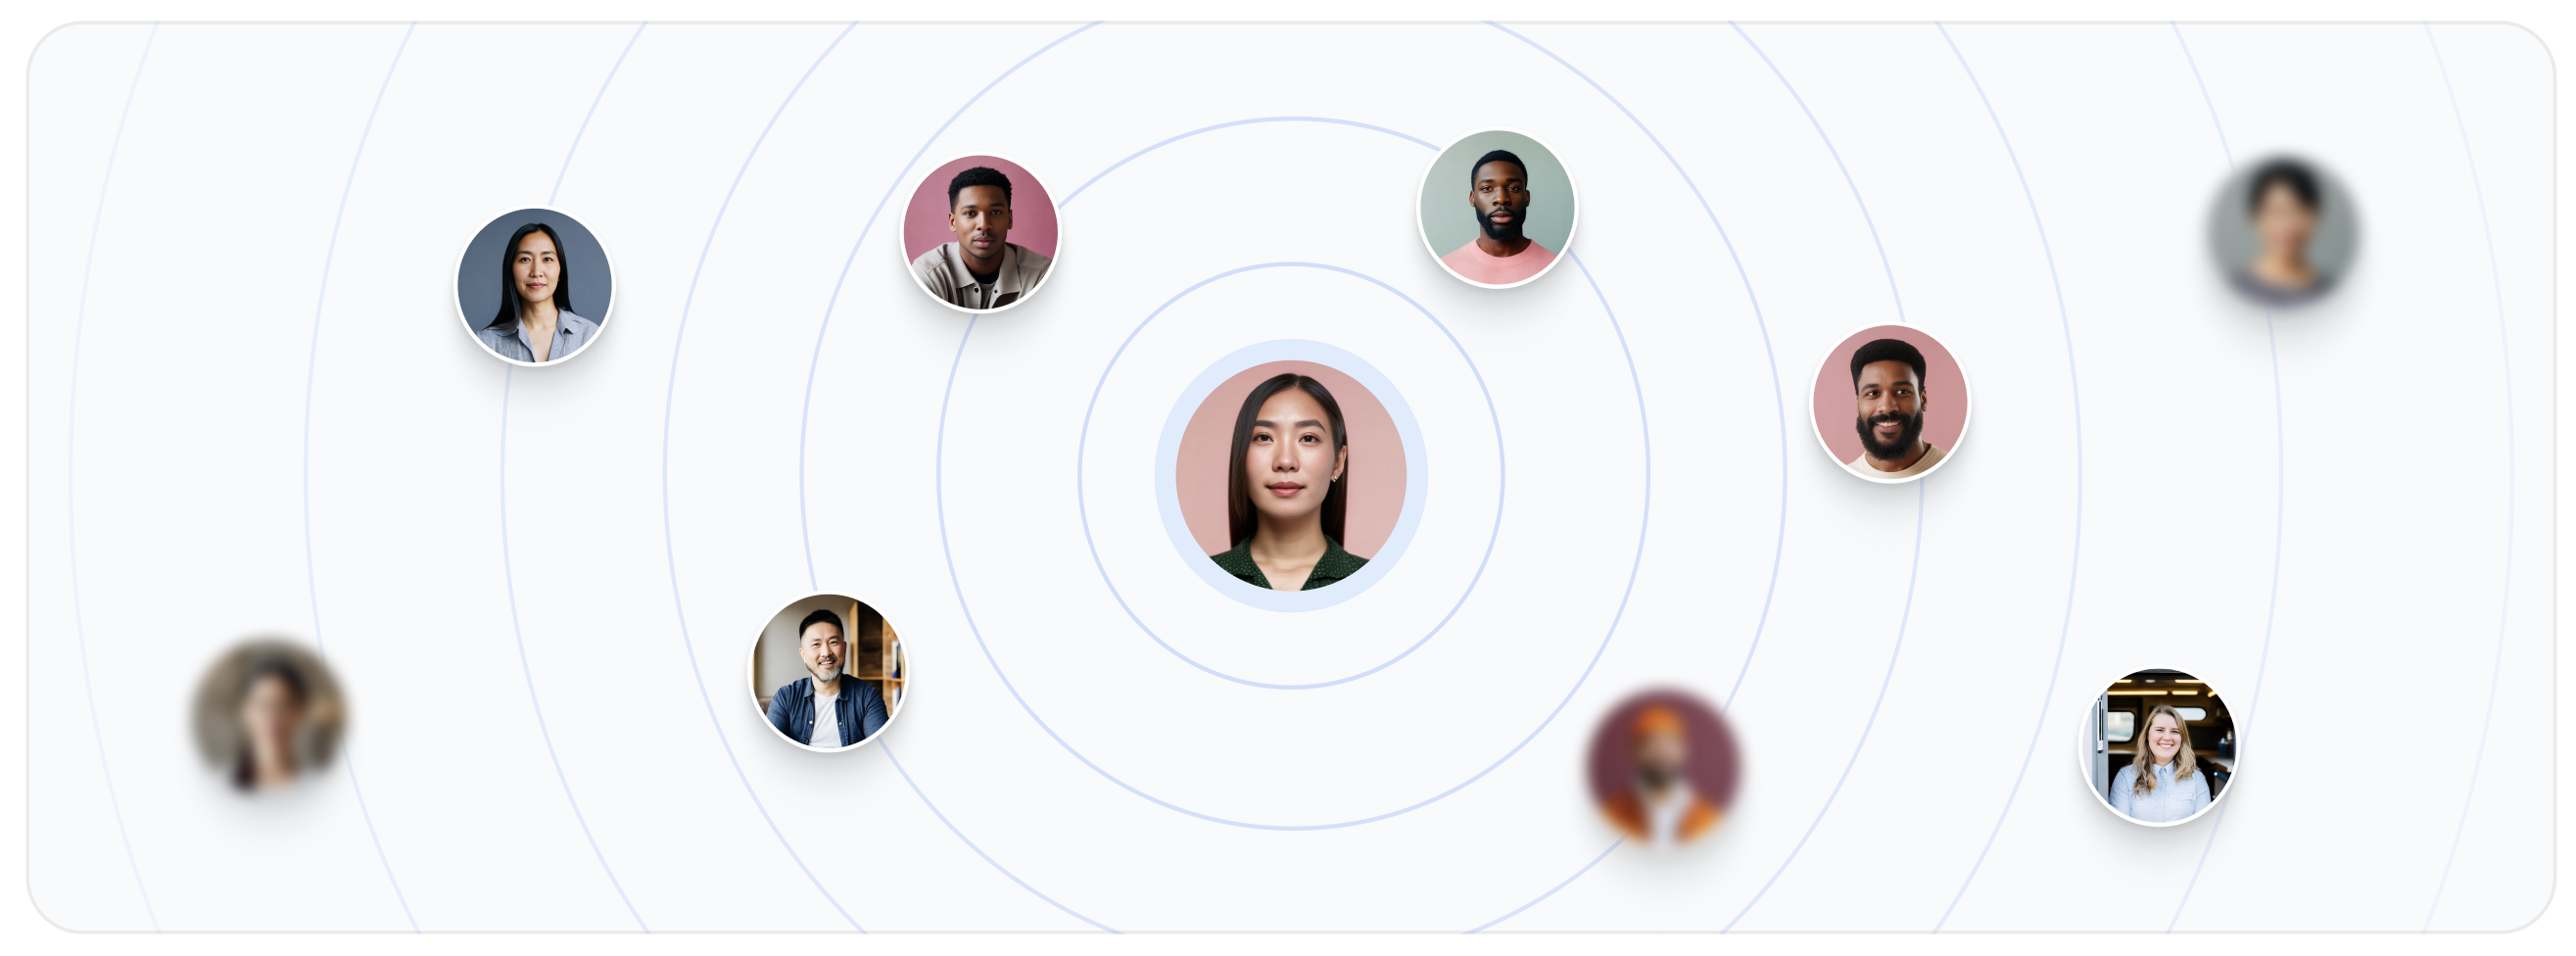
2. Predict Consensus
Users drag a slider to set the percentage they believe others will vote — not what they personally believe.
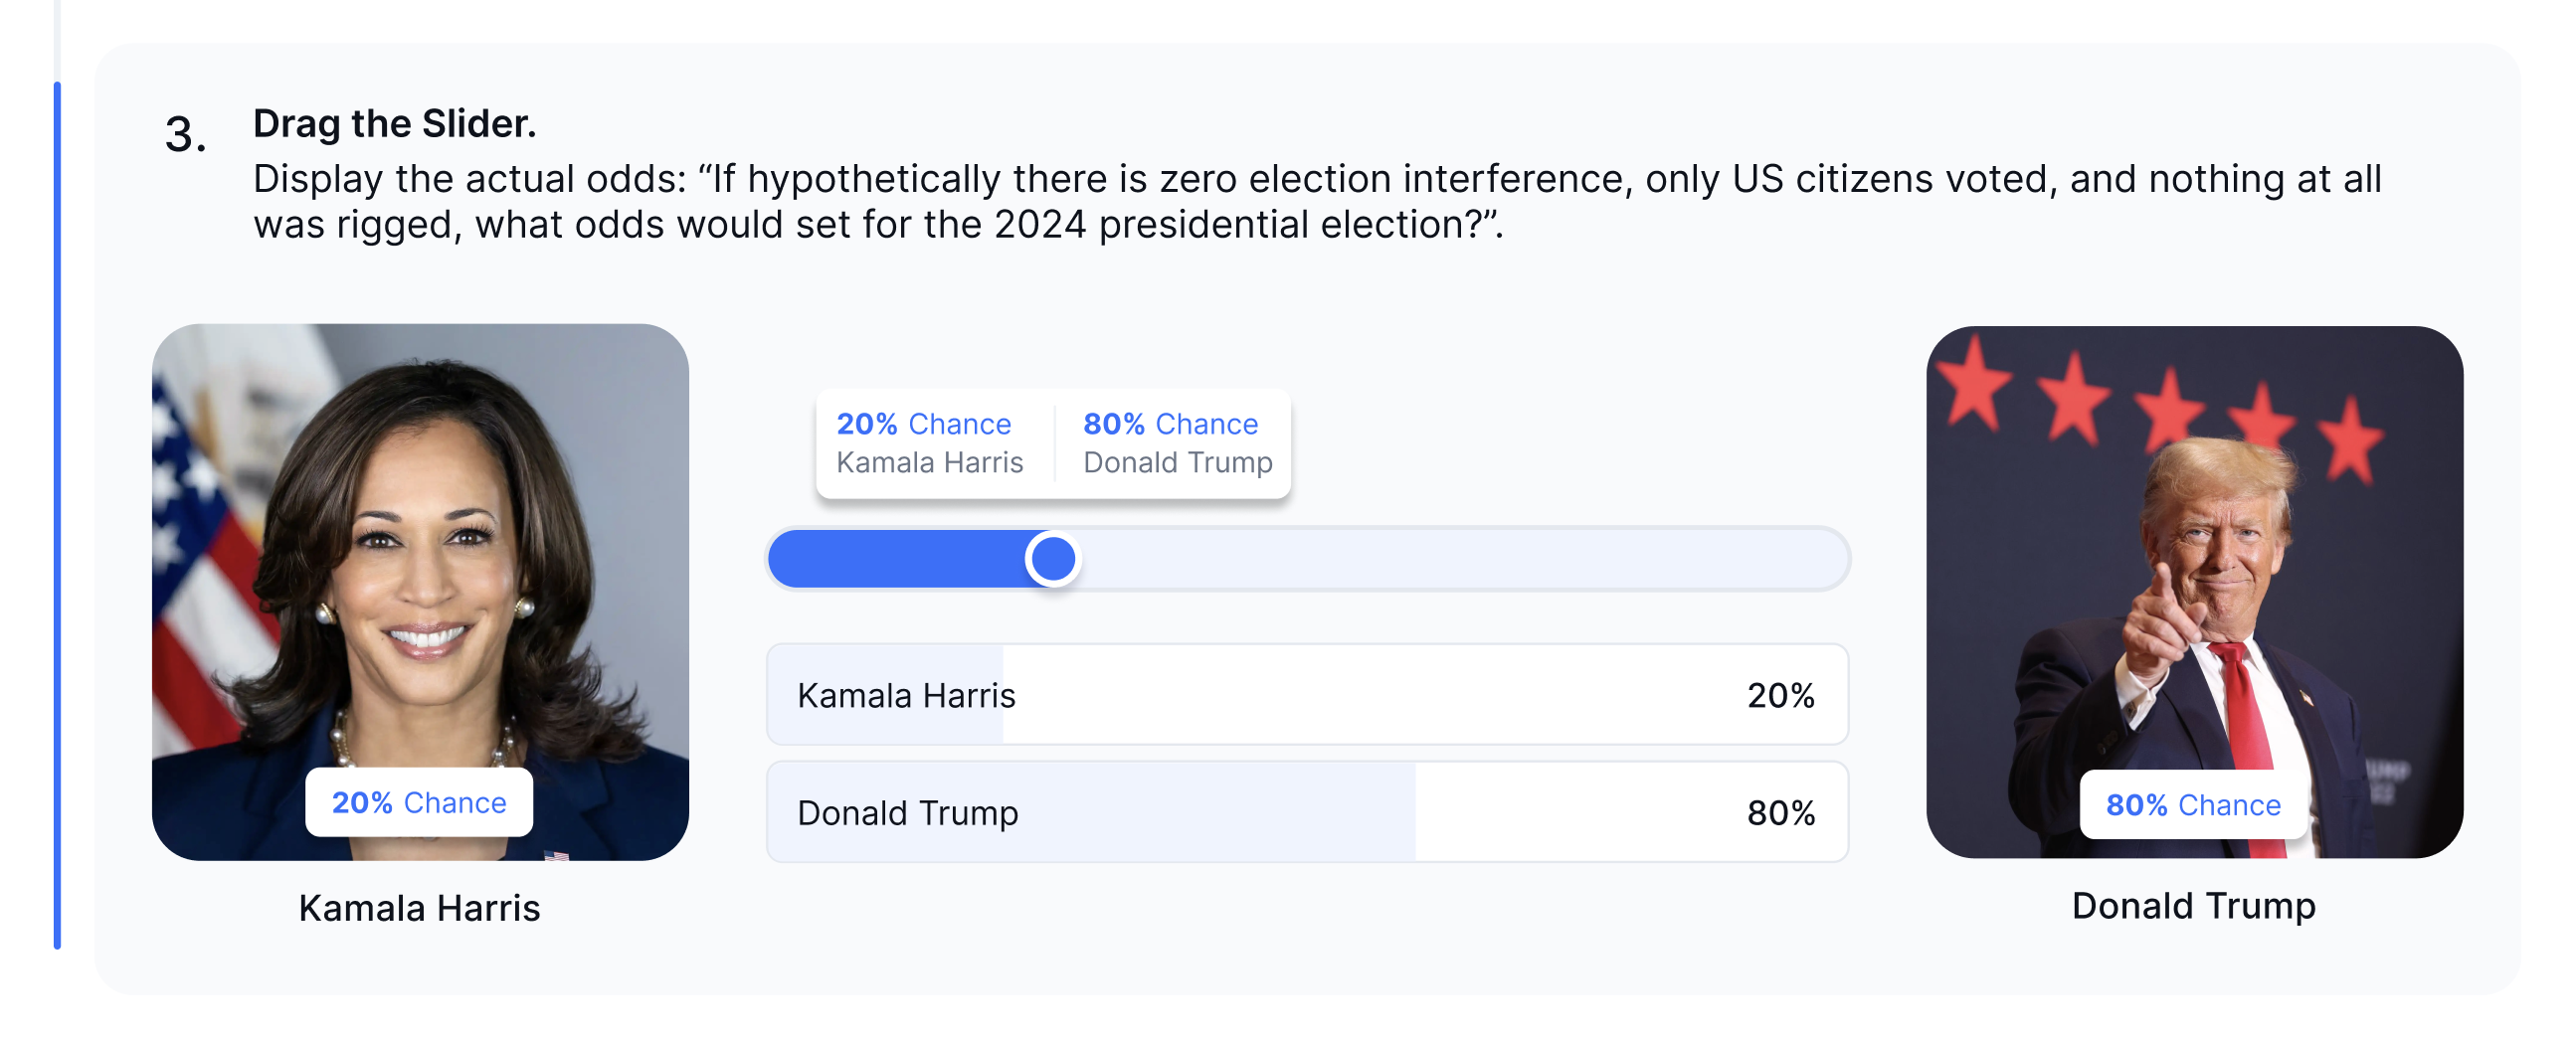
Behavioral Design:
- Default slider starts at 50% to encourage neutrality
- Subtle avatar rings show peer behavior
- Tooltip system educates first-time users on "second-order belief"
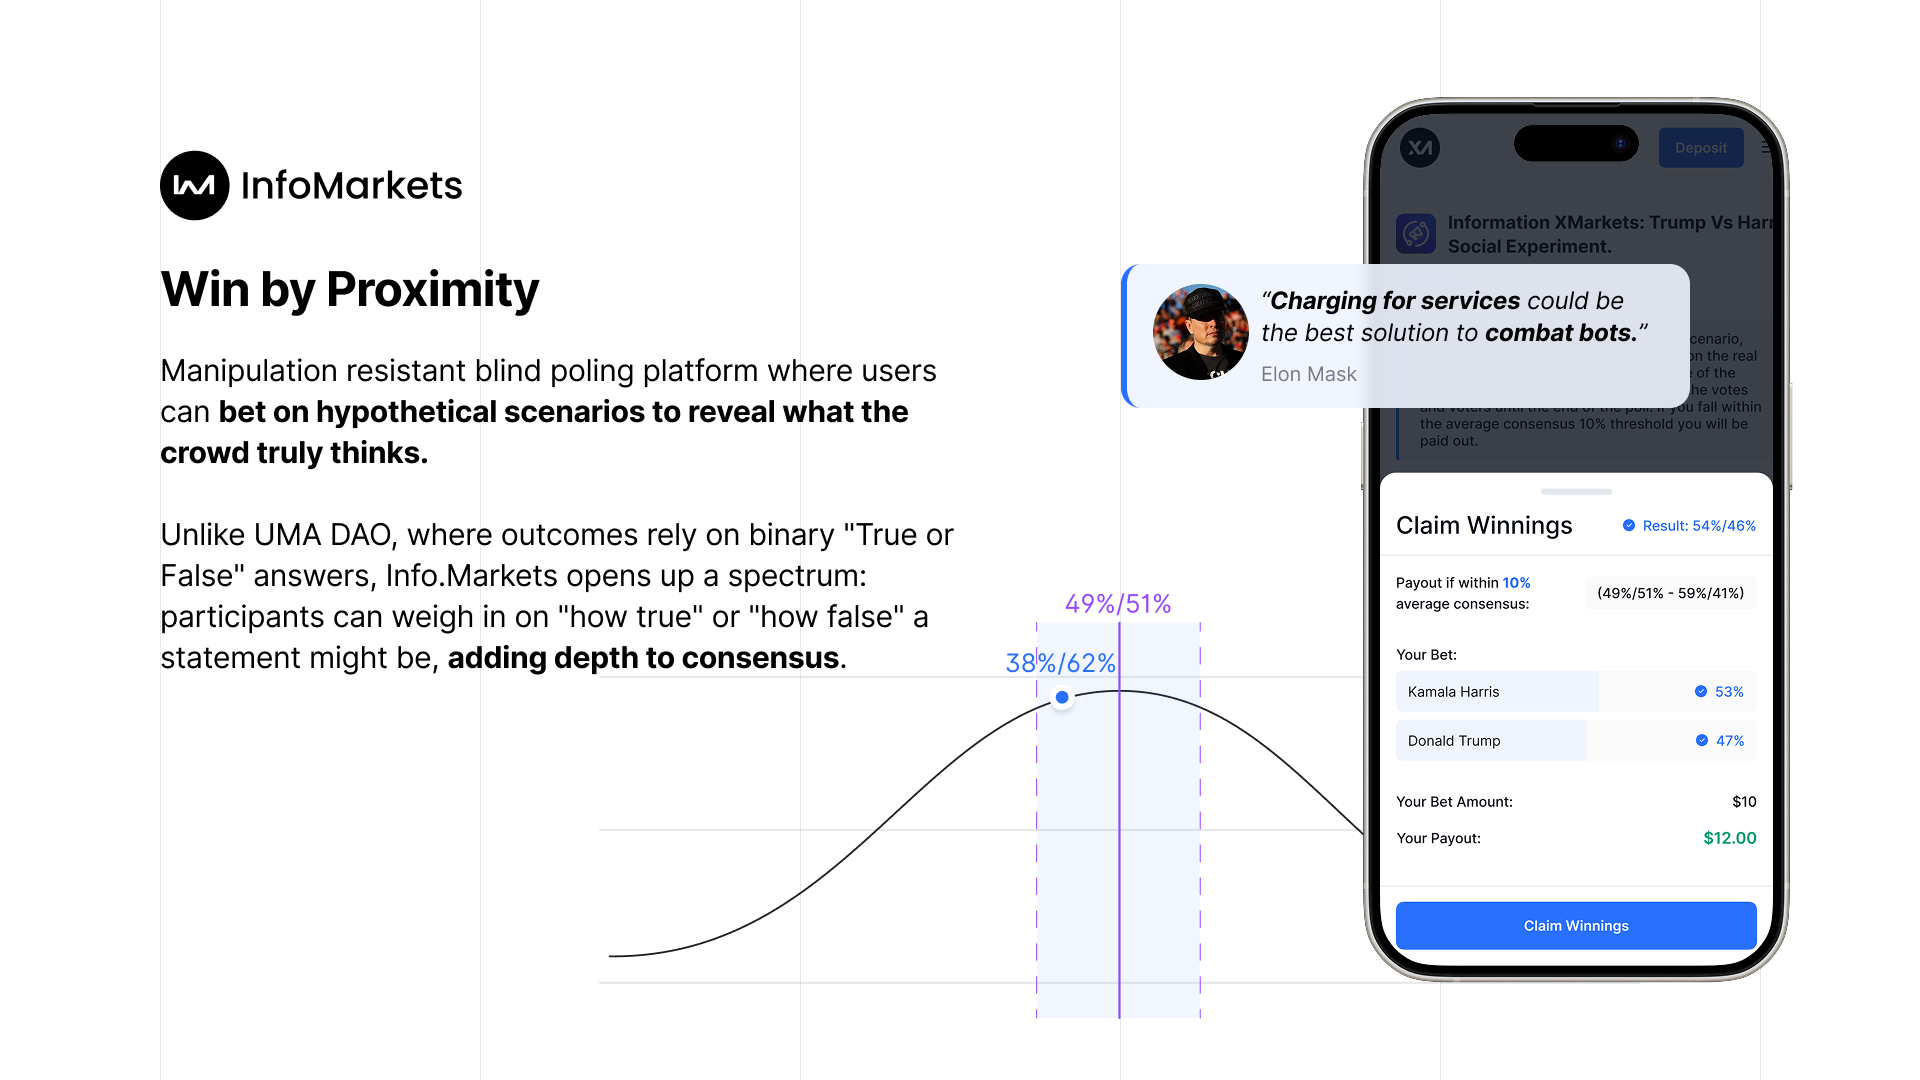
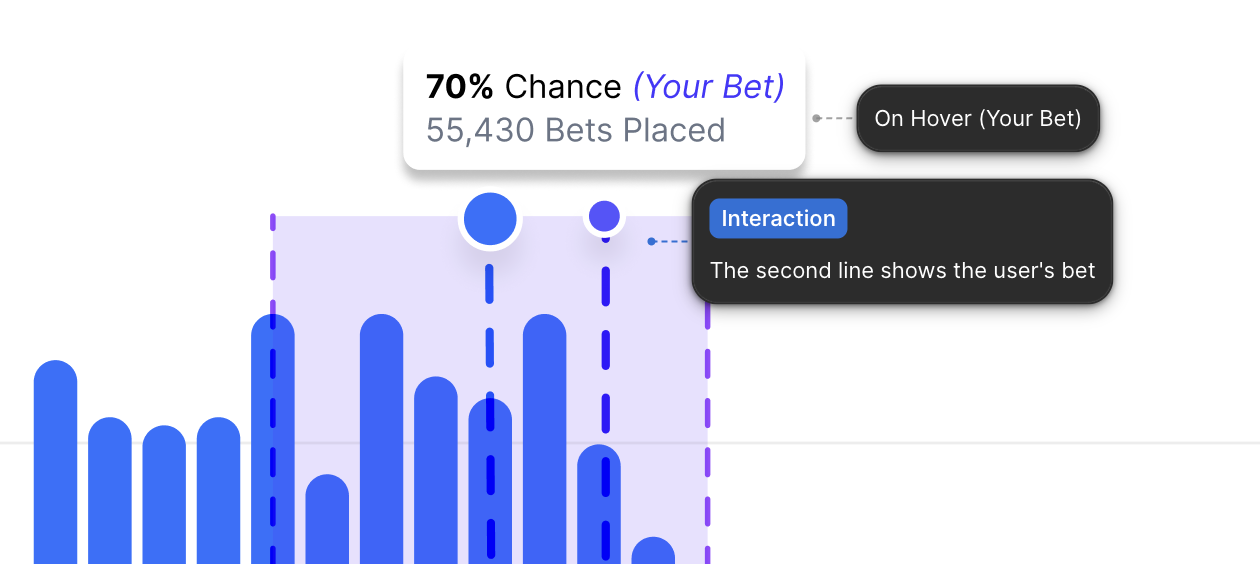
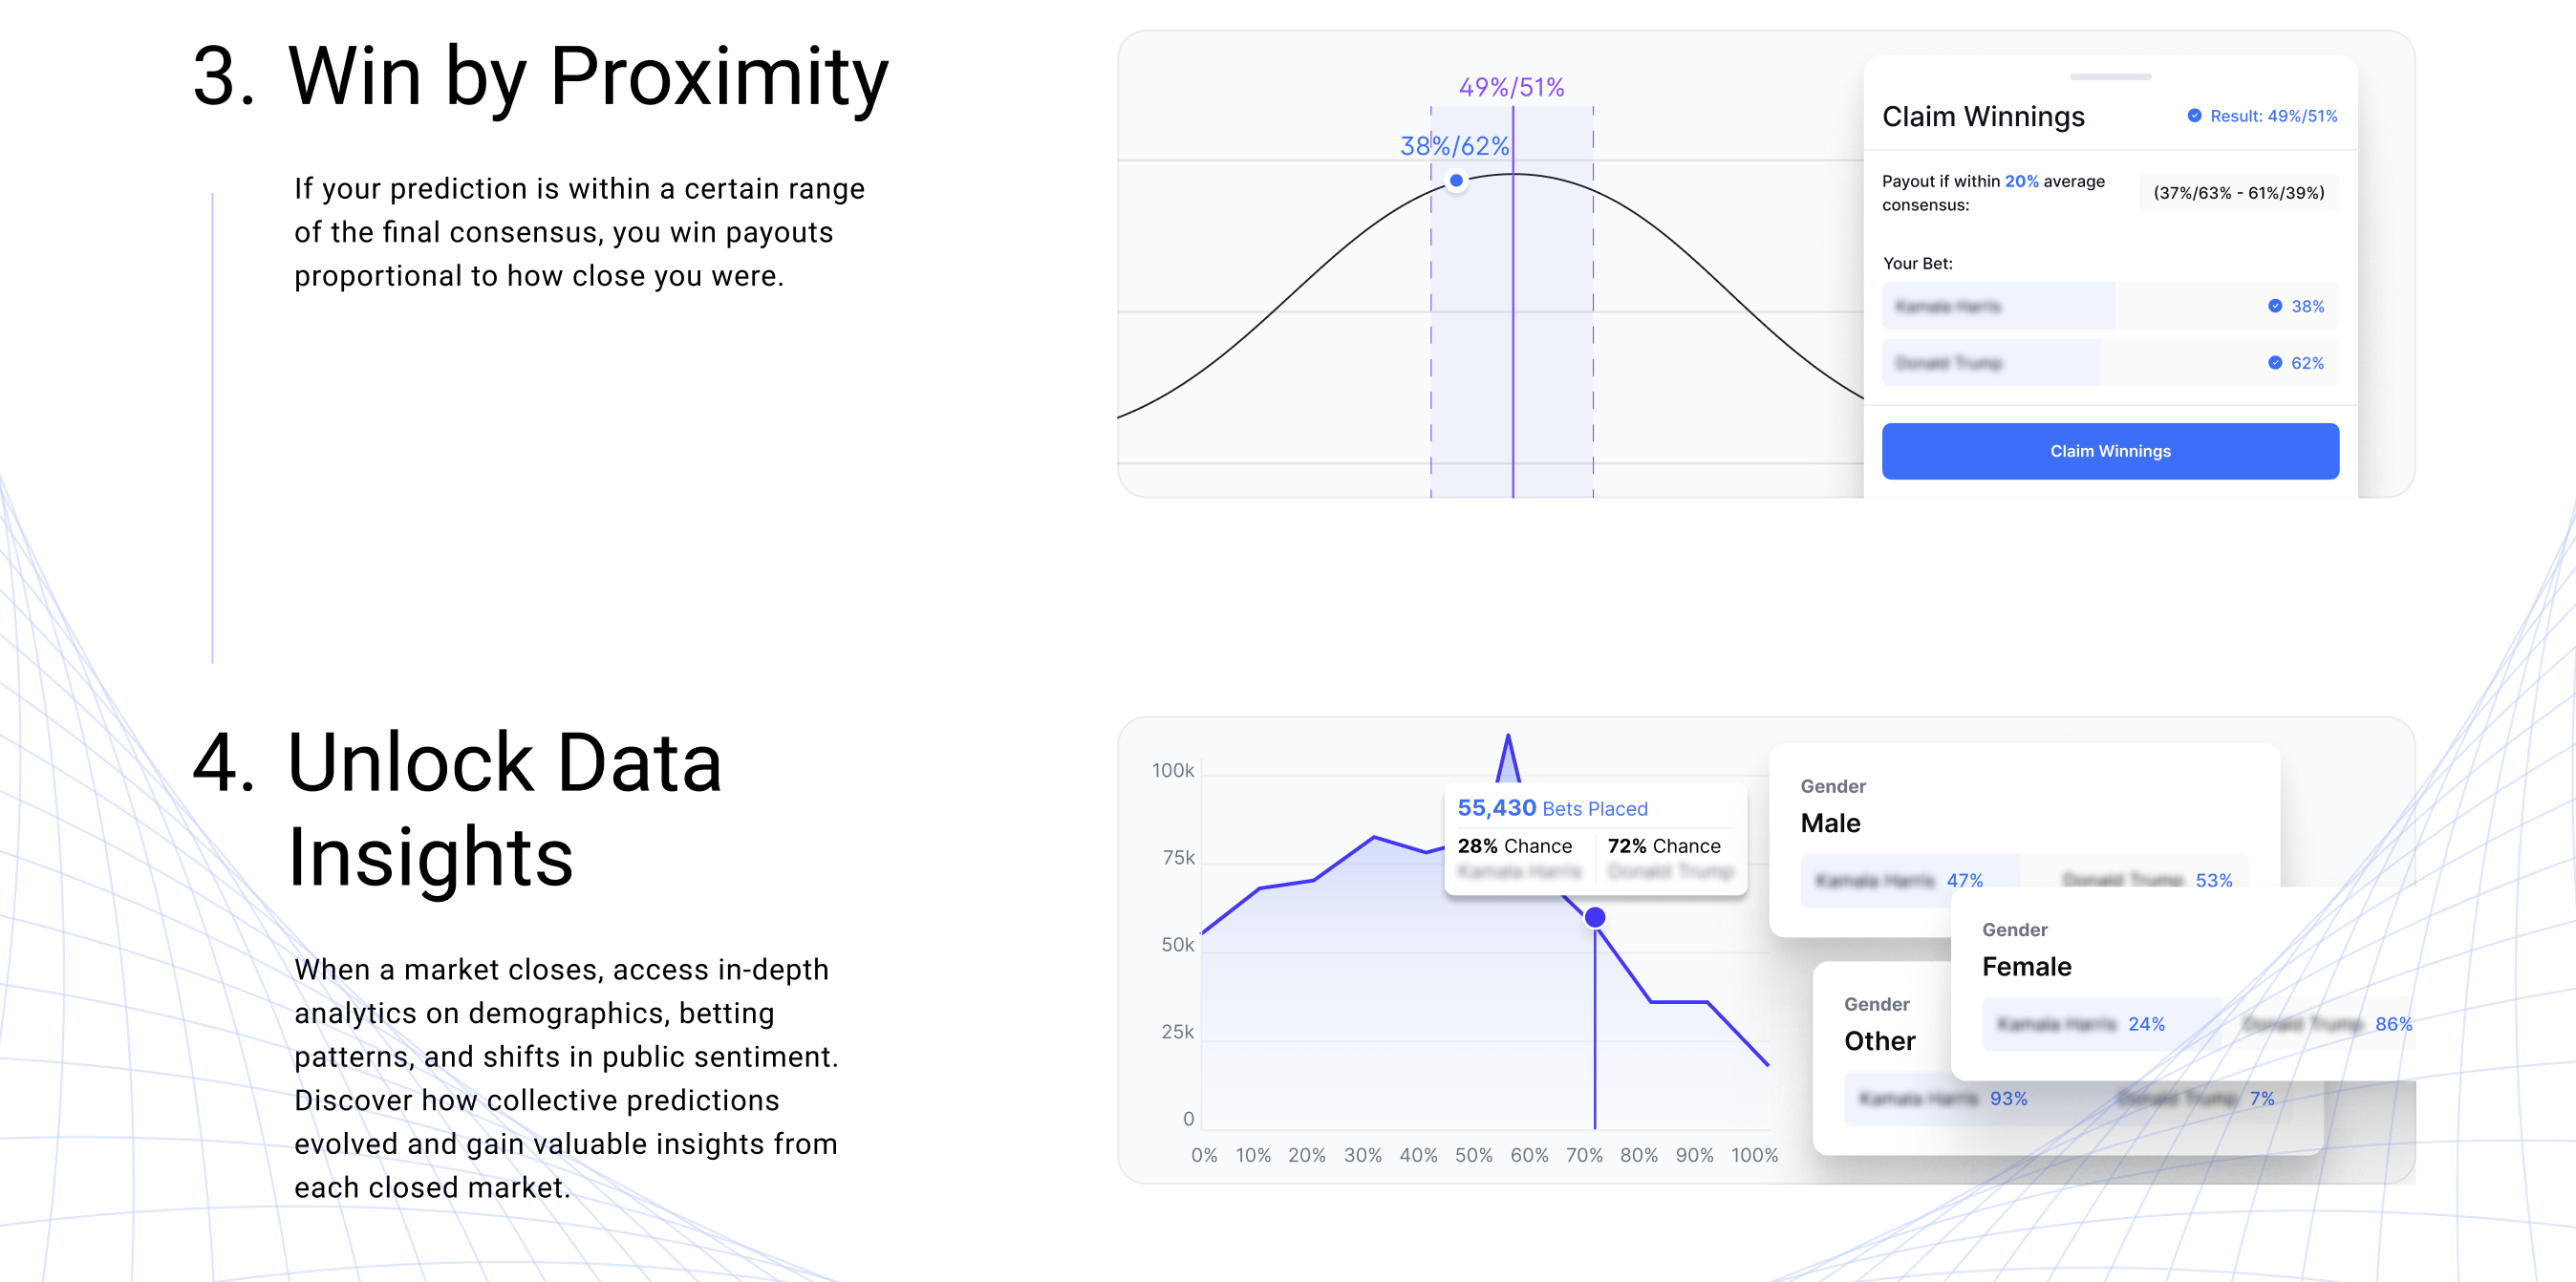
3. Win by Proximity
You win based on how close your guess is to the final crowd average — not binary correctness.
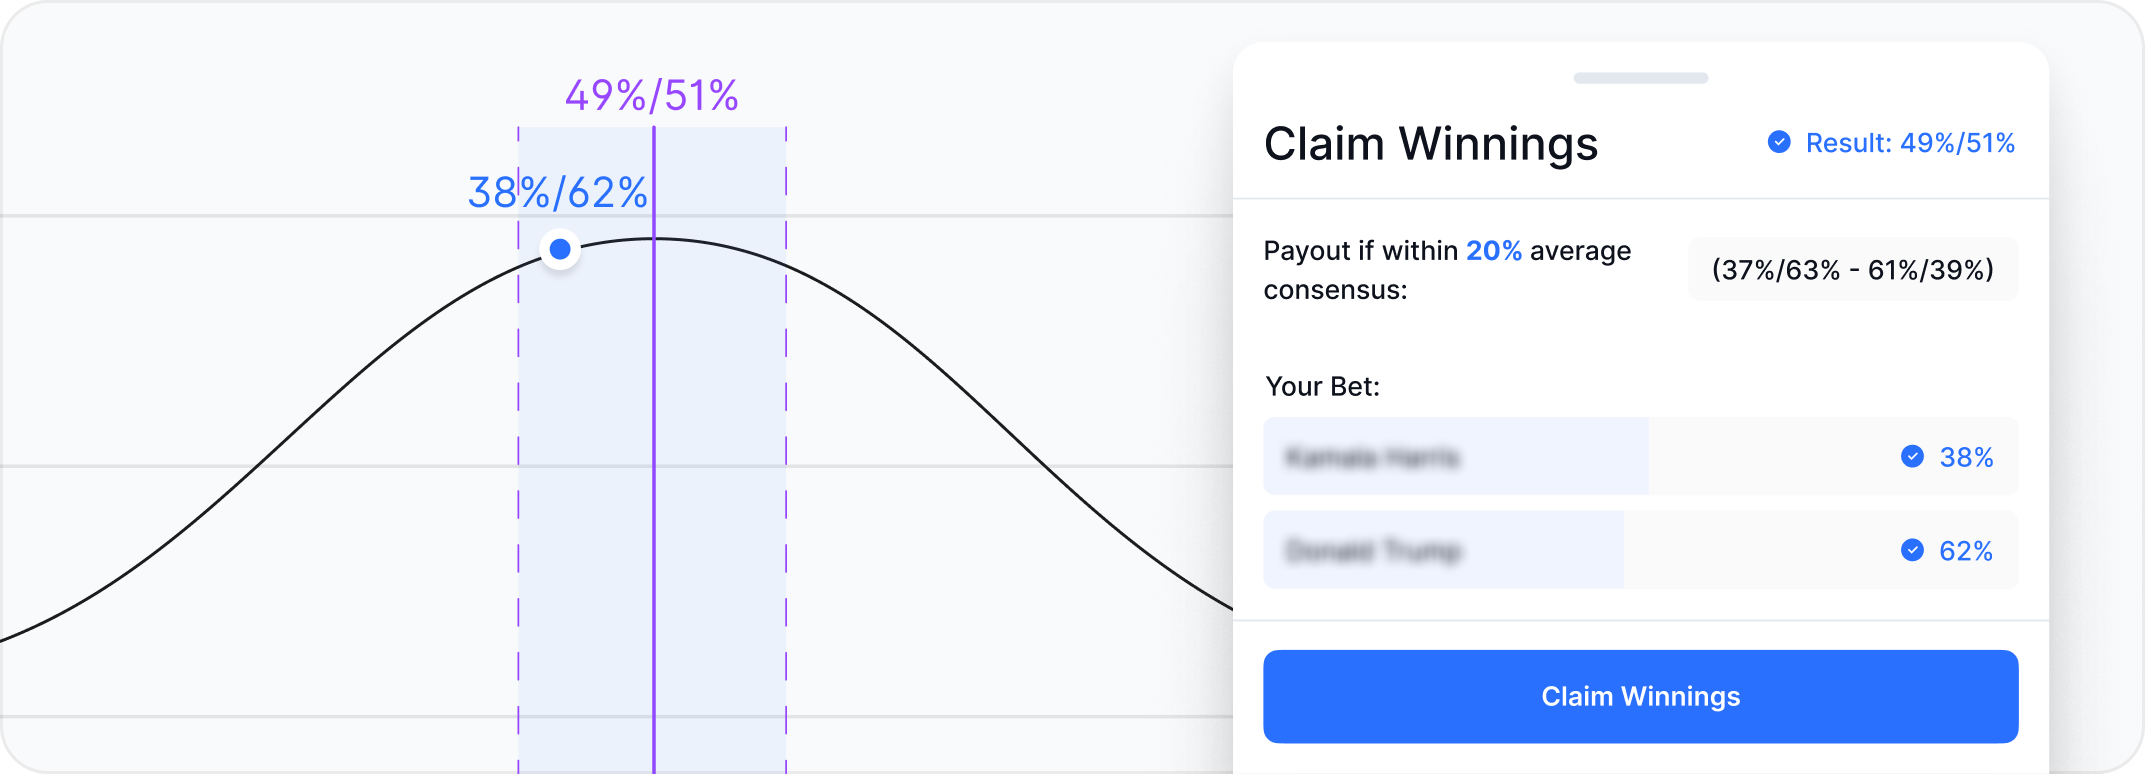
Mechanics:
- Payout bands based on standard deviation from consensus
- Visual feedback for guess vs. result
- Dynamic earnings tied to proximity, not absolute truth
Design Impact:
- Encourages more nuanced participation
- Allows multiple winners
- Feels fairer than traditional win/loss structures
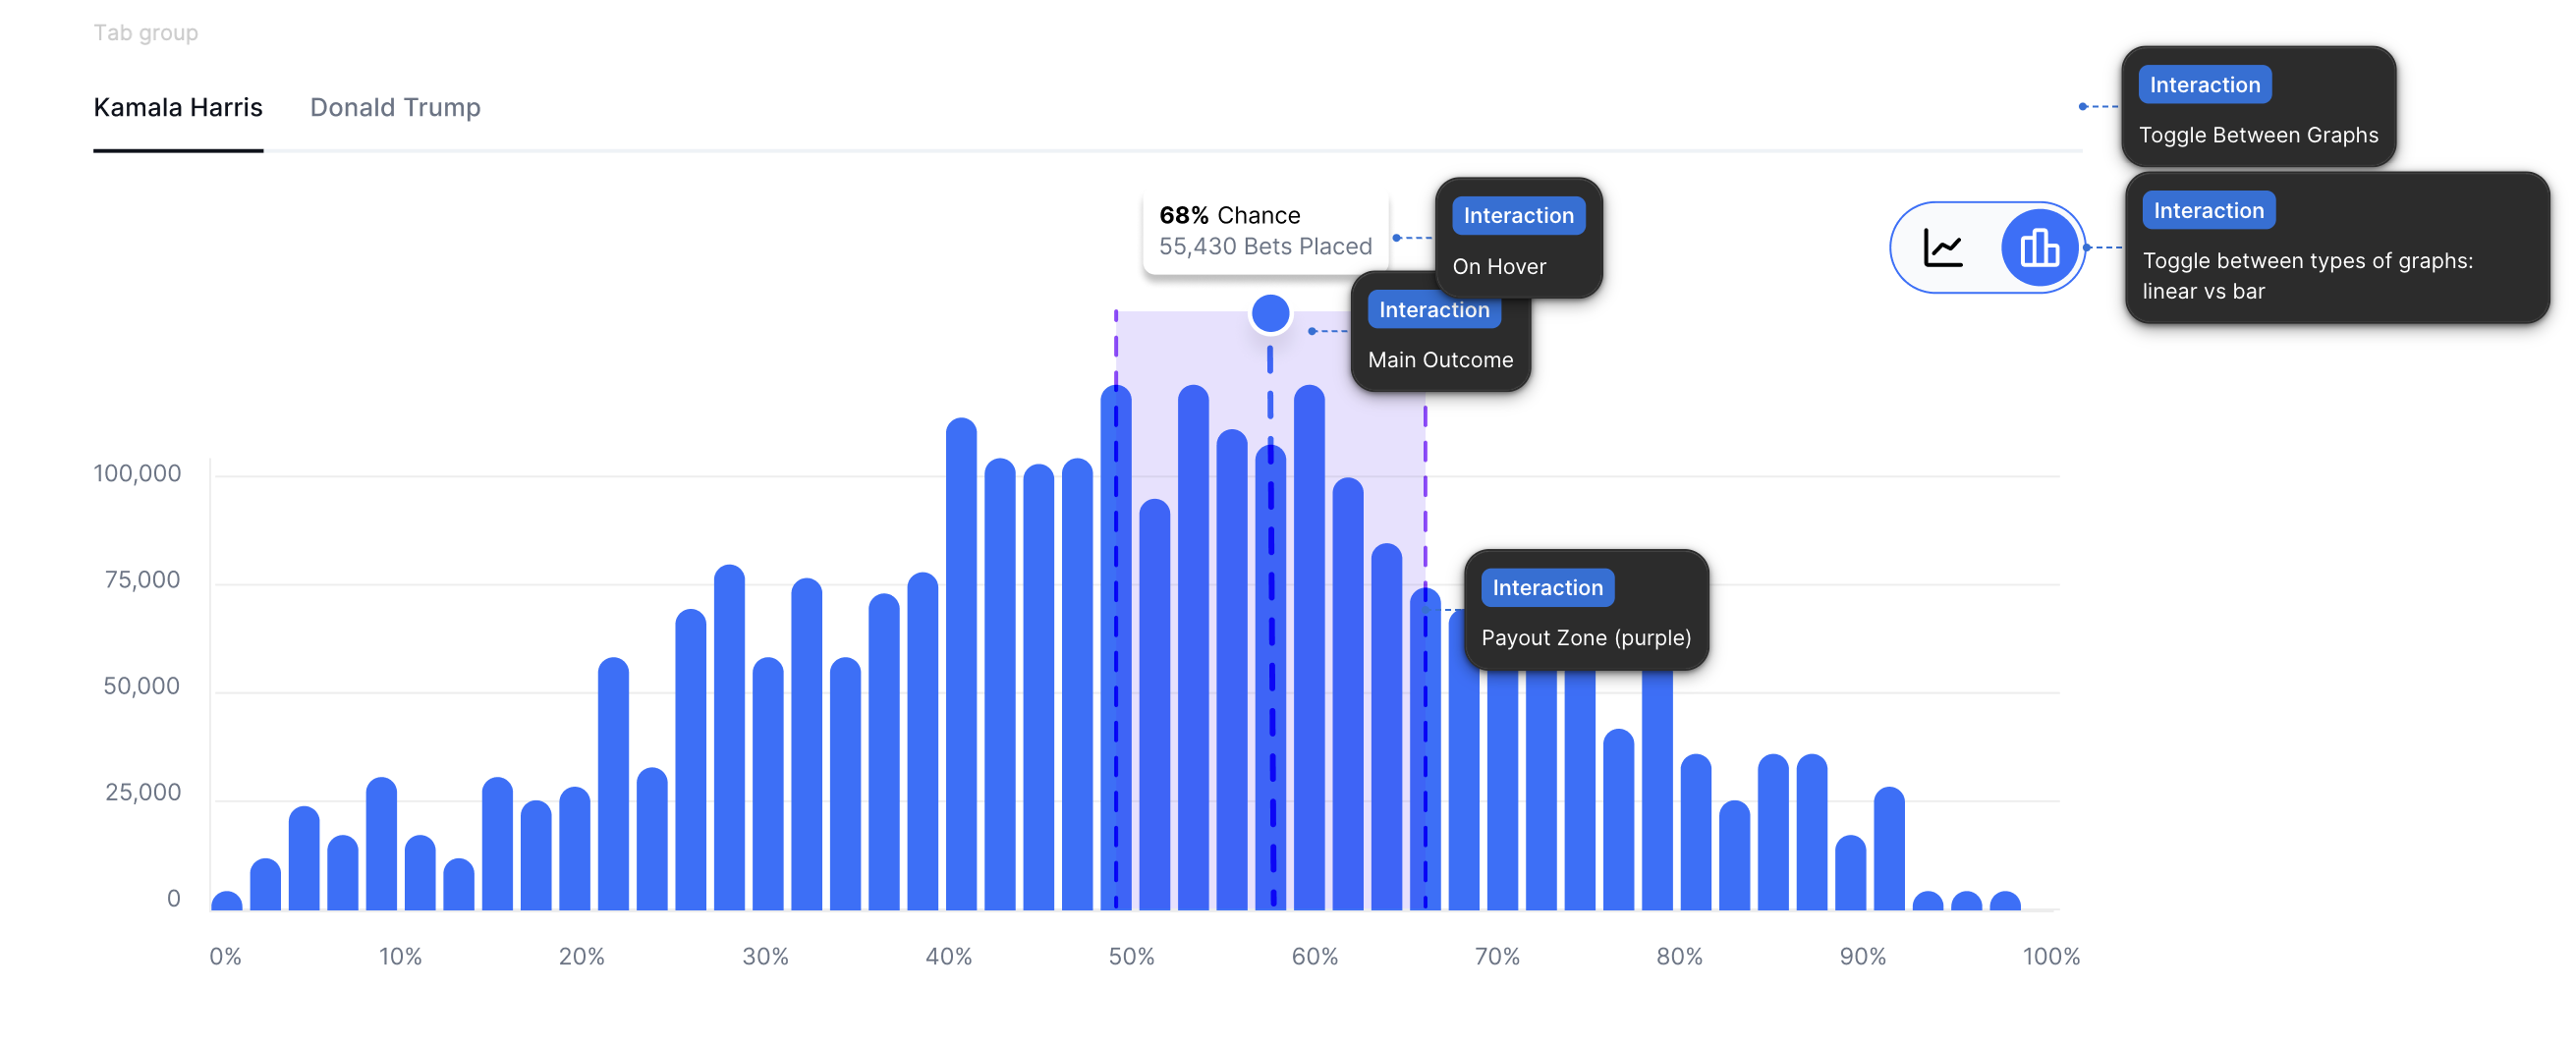
4. Post-Market Insights
When a market closes, users access a rich analytics dashboard showing how sentiment evolved.

Data Views:
- Timeline of shifting predictions
- Demographic splits (gender, age, region)
- Top predictors leaderboard
Why It Matters:
- Makes the product sticky even after the game ends
- Adds value for researchers, media, and power users
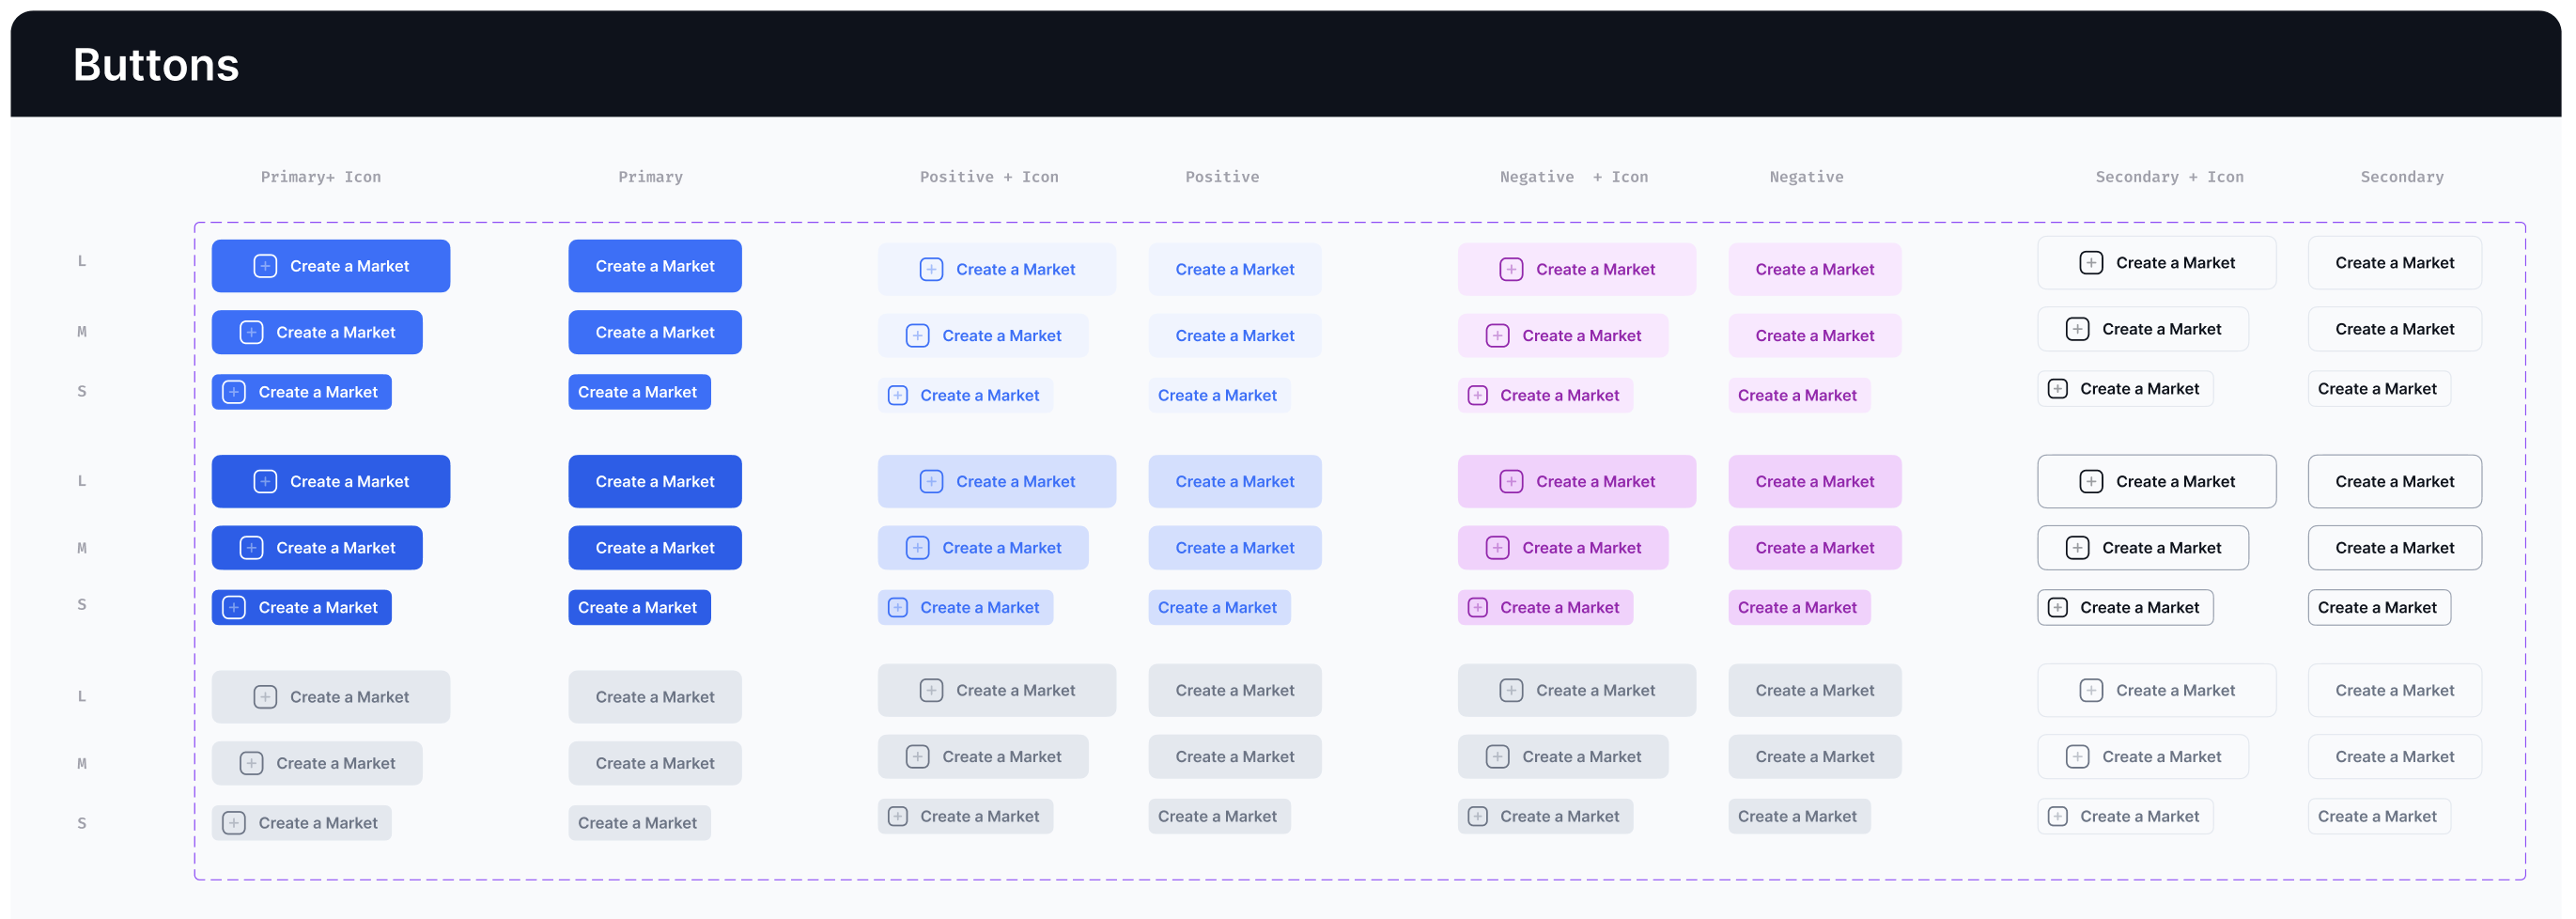
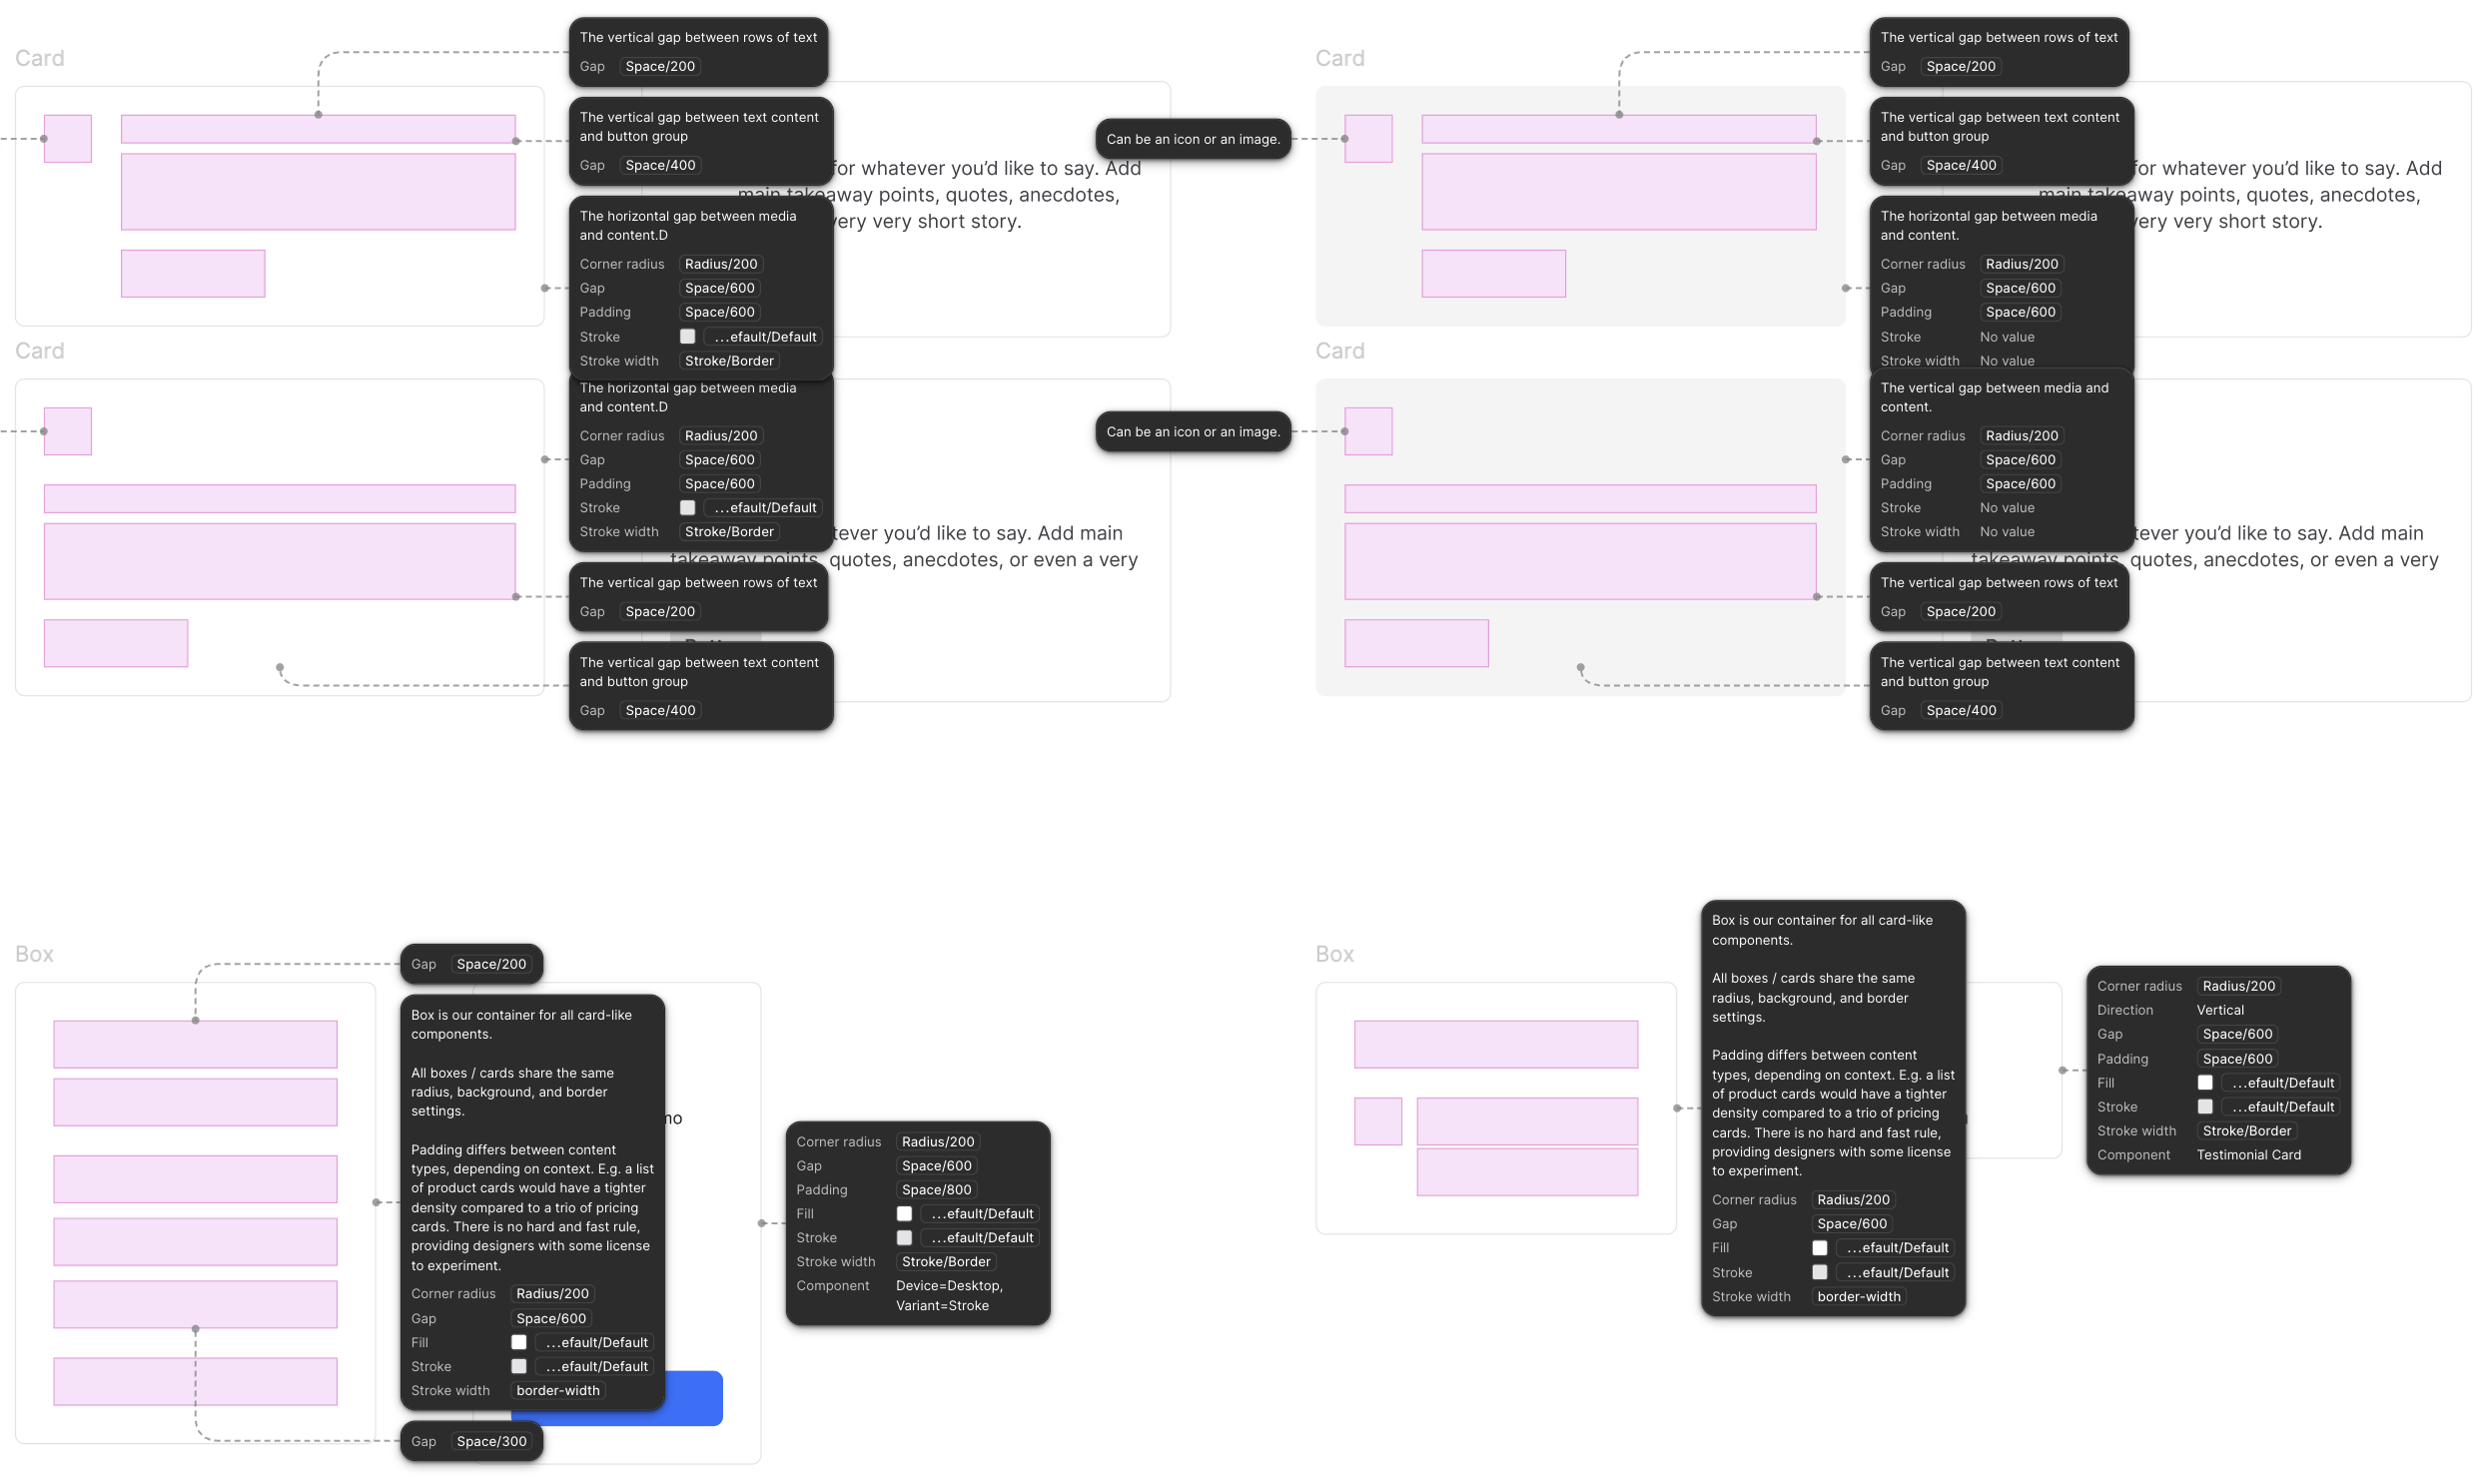
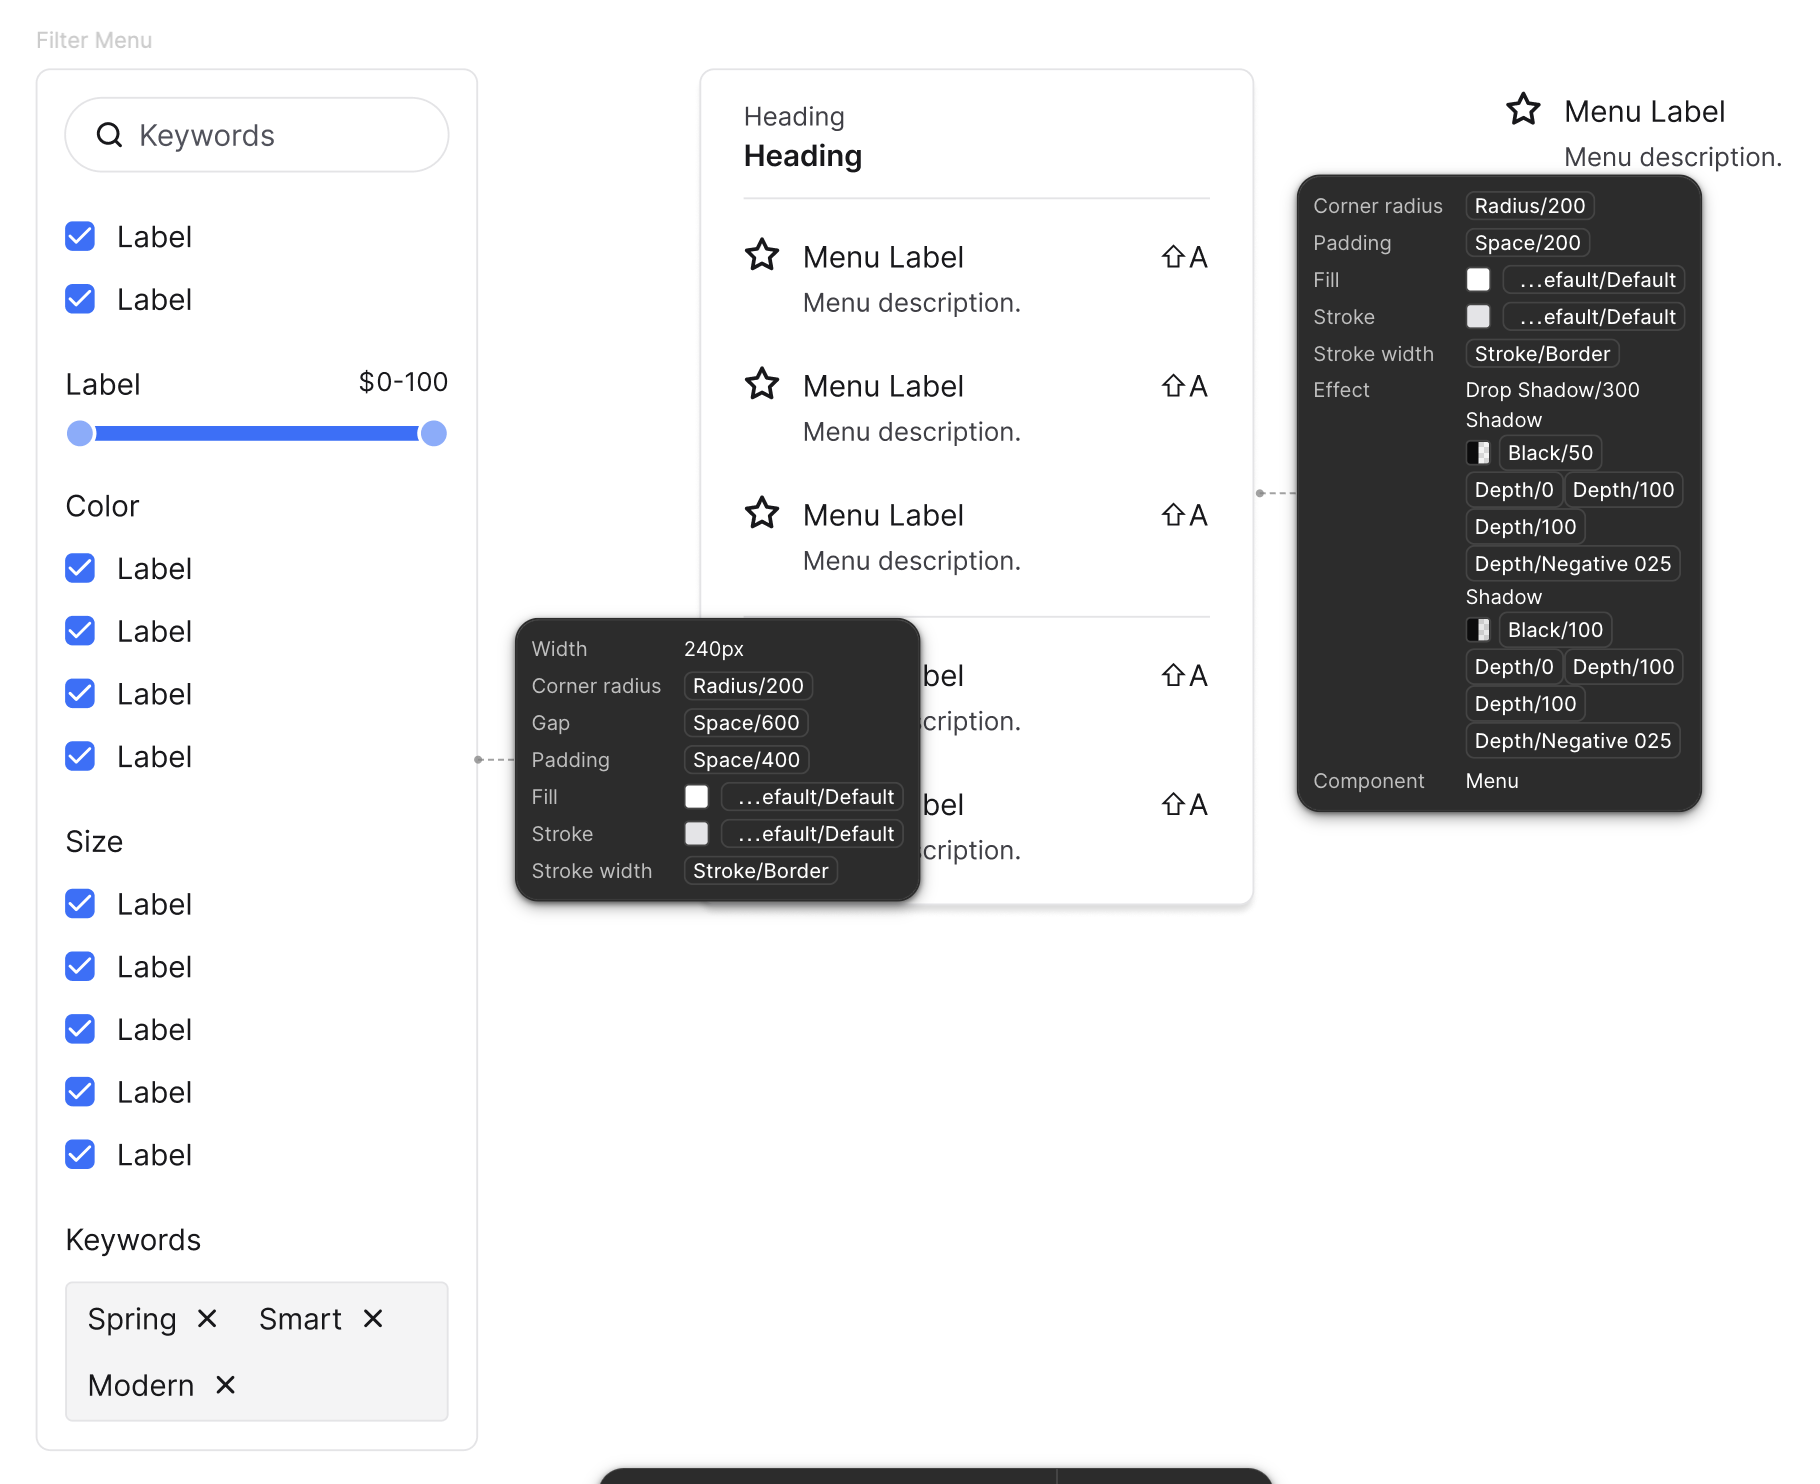
Design System
Built a scalable, production-grade system with developers in mind:
Core Principles:
- Atomic structure (Button, Card, Slider, Chart, Modal)
- Tokens for spacing, type, and colors (e.g.,
spacing-md,font-h3,primary-800) - Responsive rules for all key layouts
- Light and dark variants of every component
Interaction Logic:
Button→ States: Default, Hover, Loading, DisabledPollCard→ Props:status,theme,isUserVoted,showStatsSlider→ Behaviors:onSlide,lockOnSubmit,min/max zones
Developer Handoff
Design → Dev Practices:
- All props defined in Figma layers and documented in component notes
- Shared token files between Figma and CSS (for color + spacing)
- Used Dev Mode to highlight paddings, hover states, animations
- Embedded usage examples on the canvas for edge cases
Result: Frontend engineers were able to implement the platform in record time with minimal friction.
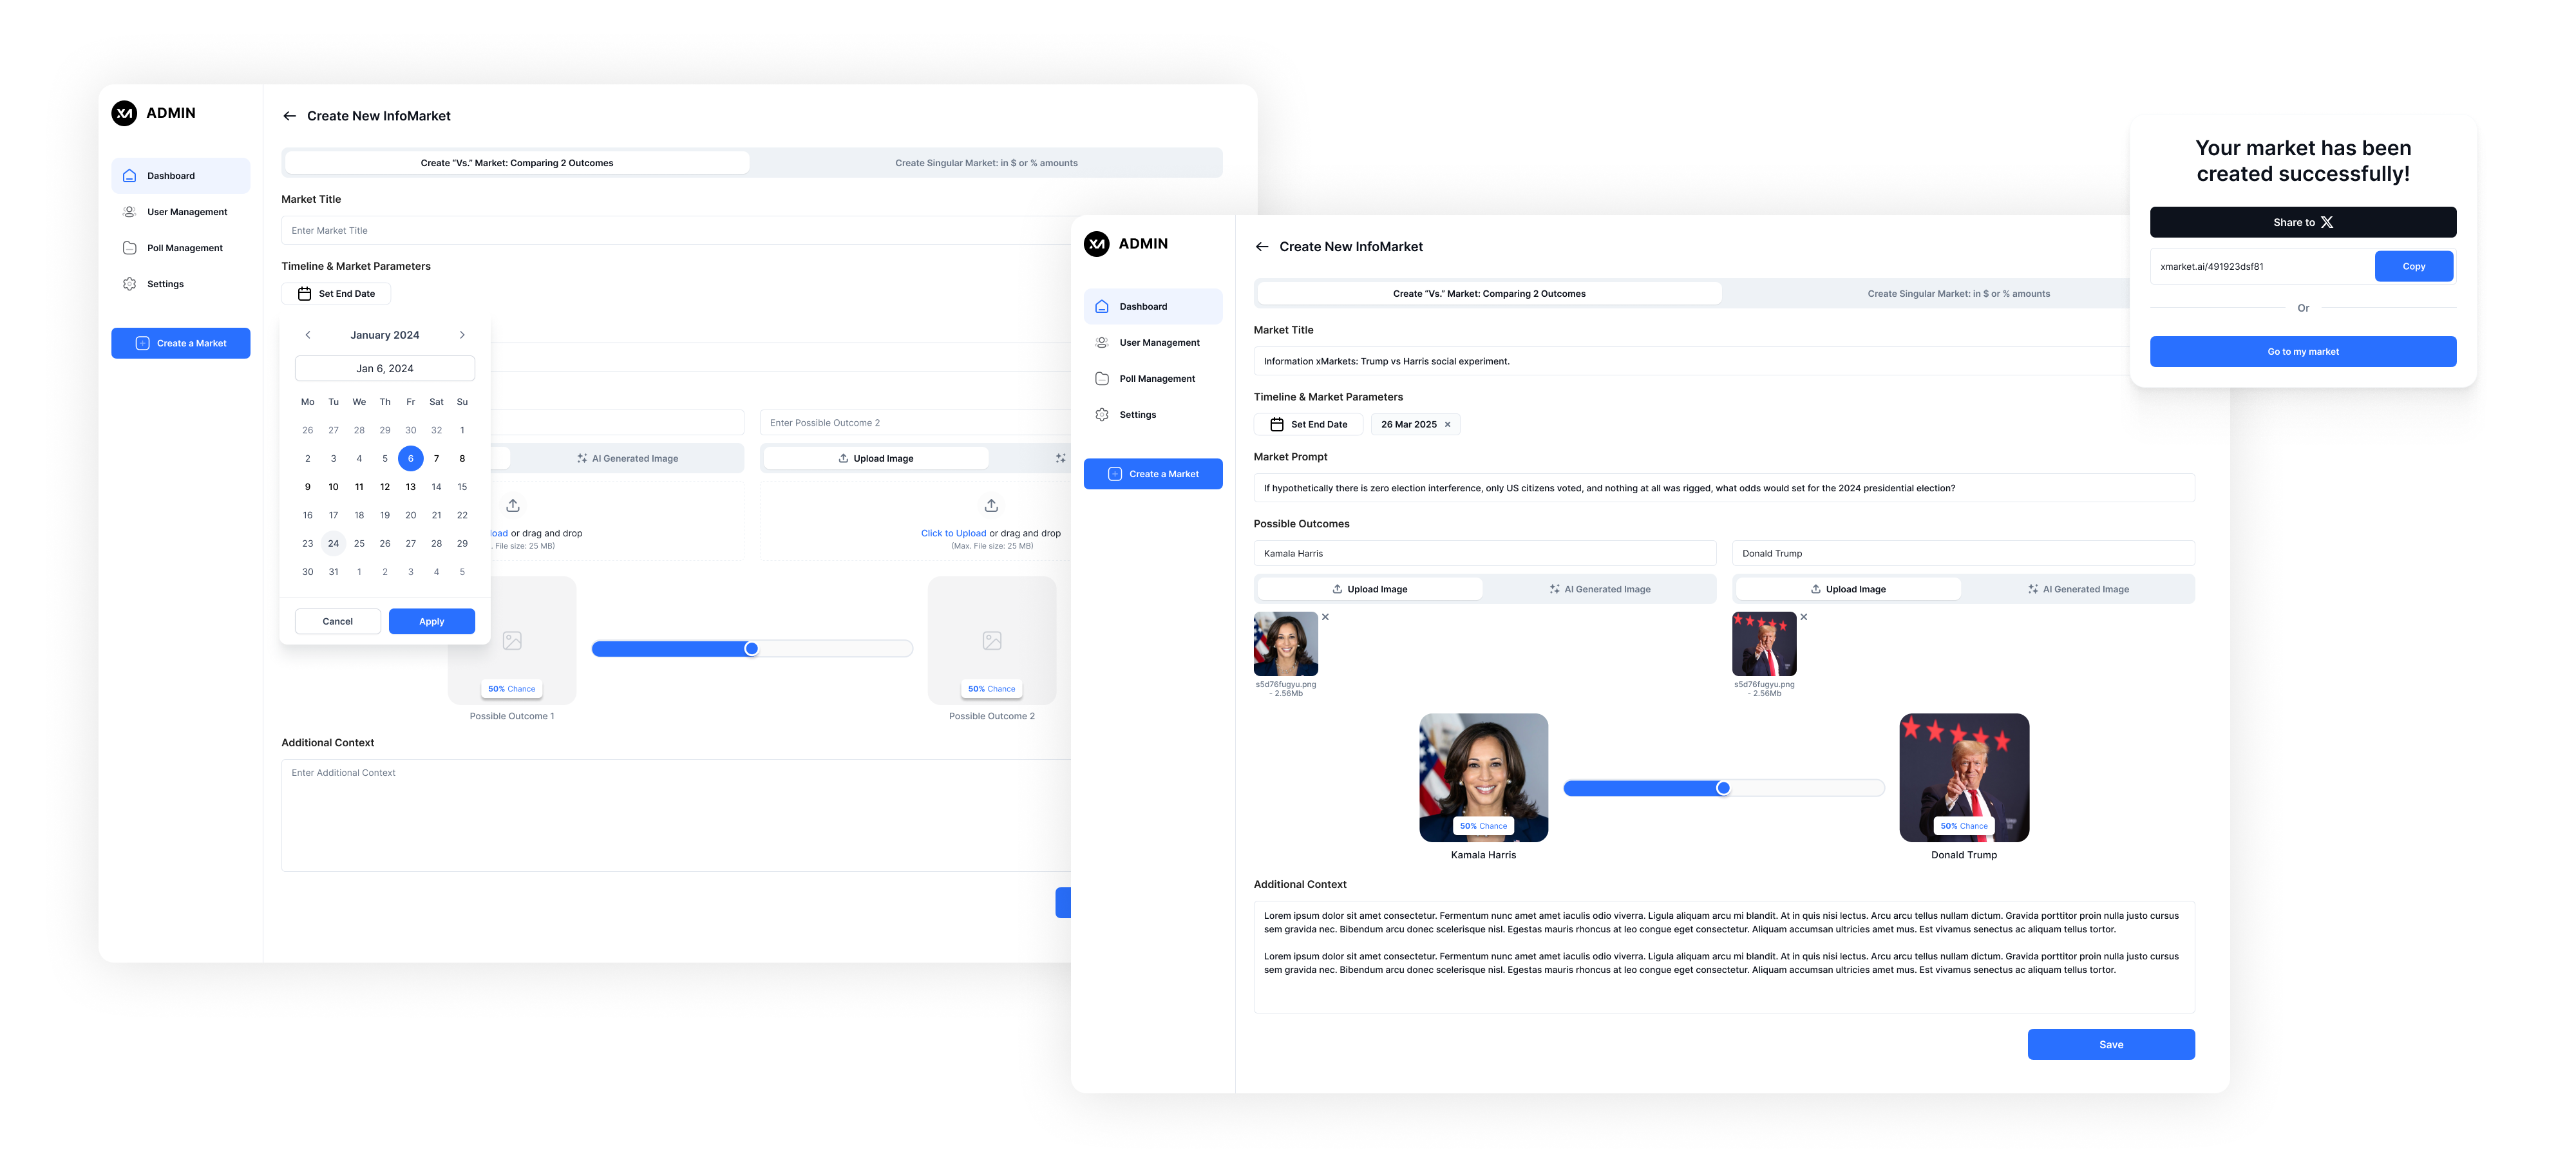
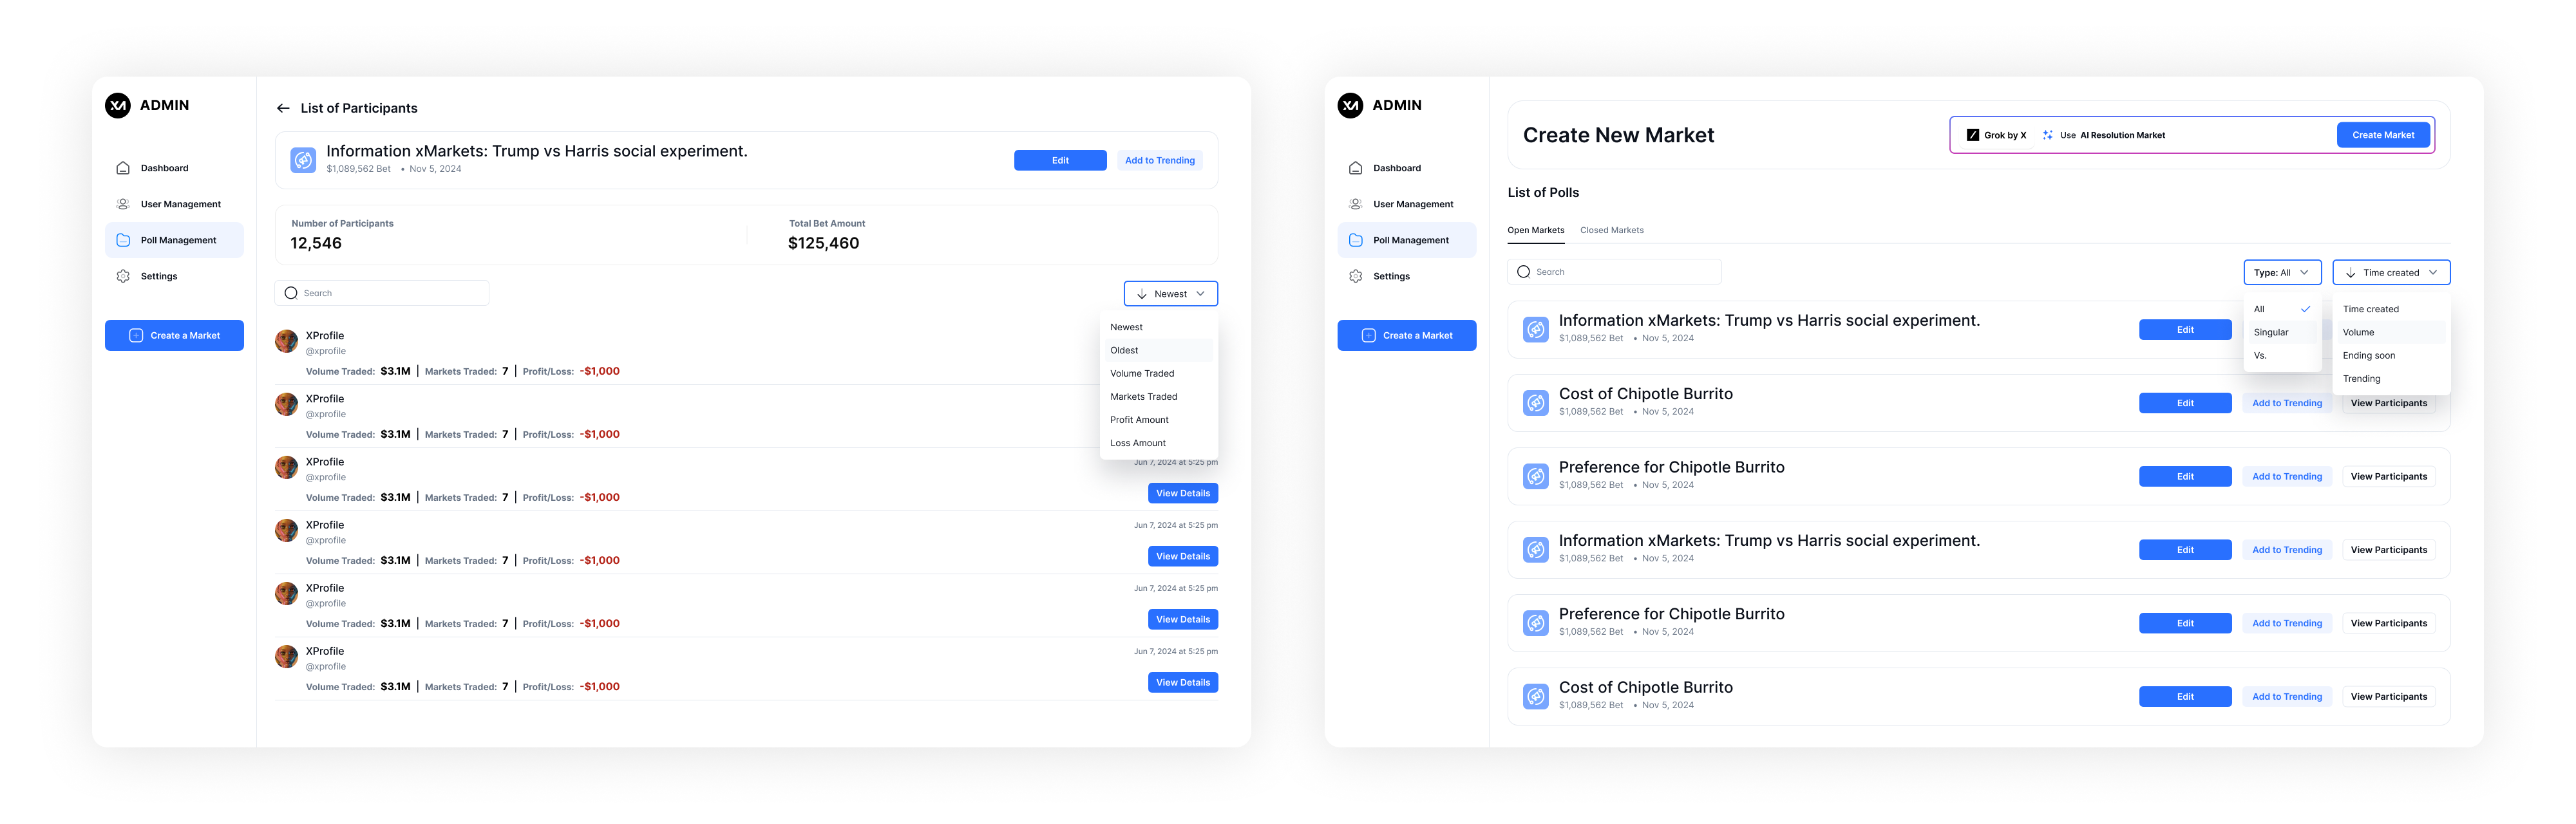
Admin Platform
Moderation and governance were essential. So we added a lightweight but powerful admin panel.
Features:
- Create and launch new markets
- View live participation stats and payout pool
- Flag and resolve suspicious activity
- Freeze or cancel abusive markets
Branding & Marketing Support
The brand needed to feel credible, futuristic, and slightly provocative. Think: Bloomberg meets crypto-native.
Deliverables:
- Pitch deck (used to secure early investor interest)
- Marketing site with animations
- Motion preview cards for Twitter/X
- OpenGraph image system
Design Language:
- Sharp grid, clean type, high contrast
- Subtle gradient flows for motion
- Dark/light mode parity

What I Loved
InfoMarkets pushed every design muscle:
- Behavioral psychology
- Systems thinking
- Visual storytelling
- Developer collaboration
Design wasn’t decoration — it was the product.
This case study reflects everything I believe in: that design should teach, persuade, challenge, and scale. It’s not just what users click — it’s what they understand. And that understanding is what drives real value.

.png)
.png)
.png)


